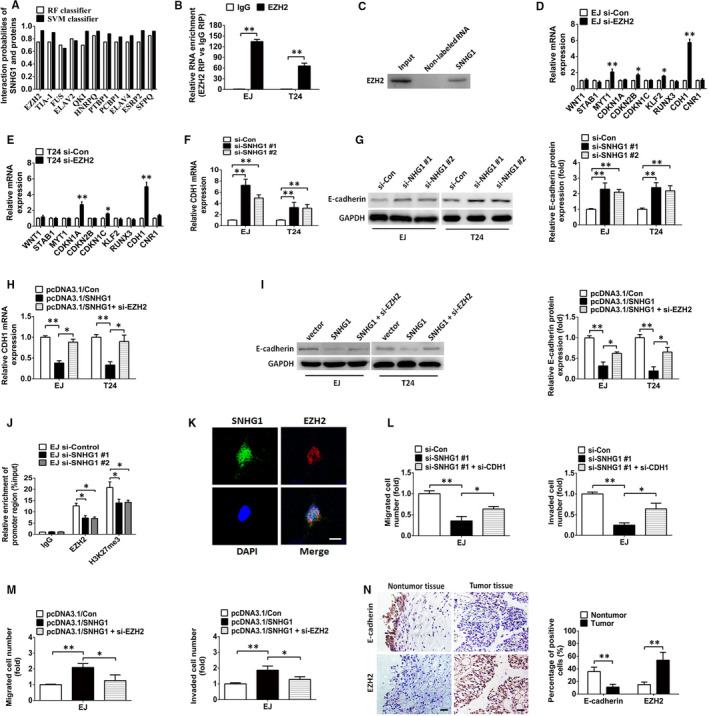
FIGURE 6.

SNHG1 epigenetically inhibits CDH1 by interacting with EZH2 in the nucleus. A, The interaction probabilities of SNHG1 and potential binding proteins were estimated using a bioinformatics tool (http://pridb.gdcb.iastate.edu/RPISeq/index.html). B, RIP assays were performed and RT‐qPCR was used to assess the enrichment of SNHG1 in the co‐precipitated RNA. C, RNA pulldown was performed to detect the association of SNHG1 and EZH2. D‐E, RT‐qPCR analysis of mRNA expression levels of candidate genes in BC cells transfected with si‐EZH2. F, The abundance of CDH1 mRNA was evaluated in BC cells transfected with si‐Control or si‐SNHG1 via RT‐qPCR. H, RT‐qPCR assay of CDH1 mRNA level in BC cells transfected with the SNHG1 vector or cotransfected with the SNHG1 vector and EZH2 siRNAs. G‐I, Western blotting analysis of E‐cadherin under the indicated conditions. J, In ChIP experiments, RT‐qPCR was used to assess the occupancy of EZH2 and H3K27me3 in the CDH1 promoter region. K, Representative FISH images showing the co‐localization of SNHG1 (green) and EZH2 (red) in the nucleus of EJ cells. Cell nuclei were DAPI counterstained (blue). Scale bar, 10 µm. L, Cellular migration and invasion of EJ cells transfected with SNHG1 siRNAs or cotransfected with SNHG1 and CDH1 siRNAs were examined by Transwell assays. M, After transfection with SNHG1 vector or cotransfection with SNHG1 vector and EZH2 siRNAs, the migratory and invasive capabilities of EJ cells were assessed by Transwell assays. N, IHC analysis of E‐cadherin and EZH2 protein in BC and adjacent normal bladder specimens. Scale bar indicates 50 μm. * P < .05 and ** P < .01
