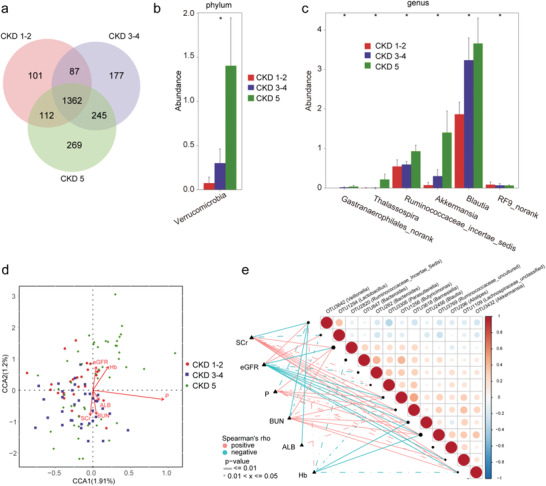
Figure 7.

Alterations of the gut microbiome along with the CKD progression. a) A Venn diagram displaying the overlaps among groups showed that the total number of OTUs was 2353, and 1362 OUTs were shared in all groups. Noteworthy, 101 OTUs, 177 OTUs, and 269 OTUs were unique for CKD stages 1–2 (n = 26), CKD stages 3–4 (n = 36), and CKD stage 5 (n = 48), respectively. b) With the progress of CKD, the increased microbial community at the phylum level (p < 0.05). c) With the progression of CKD, the increased and decreased microbial community at the genus level (all p < 0.05). d) The CCA analysis of the associations between the gut microbiome and clinical indicators for CKD from CCA1 and CCA2 (1.91% and 1.2%). e) Heatmap showing the partial Spearman's correlation coefficients among 13 OTUs and 6 clinical indicators of CKD (n = 110). Distance correlation plots of relative abundances of 13 OTUs and the clinical indices SCr, eGFR, P, BUN, ALB, and Hb. CKD, chronic kidney disease; CCA, canonical correspondence analysis; OTUs, operational taxonomy units; Hb, hemoglobin; ALB, albumin; BUN, blood urea nitrogen; SCr, serum creatinine; eGFR, estimated glomerular filtration rate; P, phosphate.
