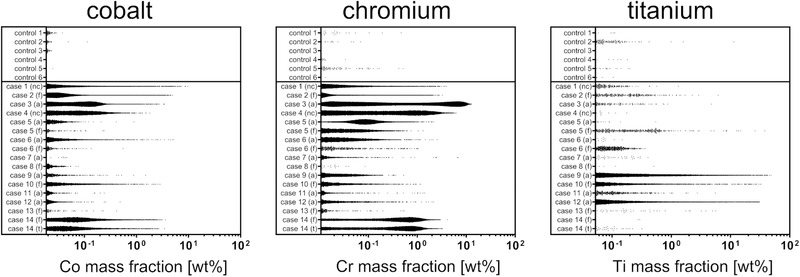
Figure 2.

Distributions of the spatial mass fractions of Co, Cr, and Ti obtained from multi‐elemental XRF‐mapping. Depicted are all data points from maps with 2–10 µm spatial resolution which are greater than the metal specific 99.9% quantile of the overall data points obtained from the control samples (Q 0.999 Co, 0.018 wt%; Q 0.999 Cr, 0.011 wt%; Q 0.999 Ti, 0.052 wt%). Data points from individual maps of the same samples were combined. Abbreviations: nc, sample location not classifiable; f, femoral; a, acetabular; t, tibial.
