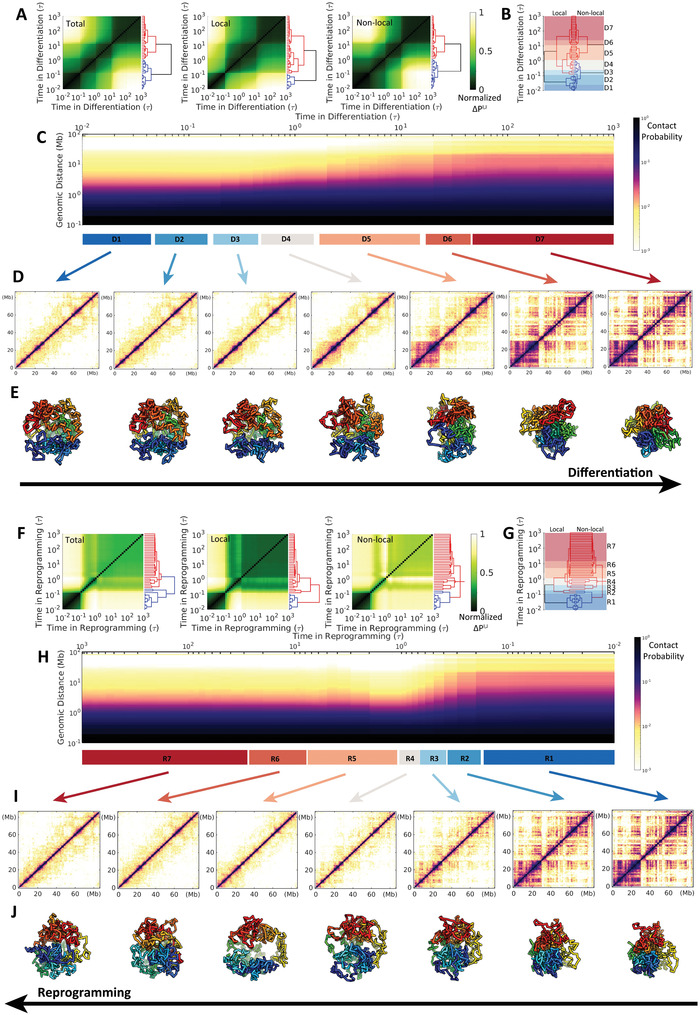
Figure 2.

Chromosomal structural rearrangement during the ESC differentiation (upper) and the IMR90 reprogramming (lower). A) Differences and hierarchical clustering of contact probability maps of the chromosome among each time frame t = I, J during differentiation varied by total, local (<2 Mb) and non‐local (>2 Mb) contact ranges. The contact map difference ΔP I, J is calculated by: , where is the contact probability between chromosomal loci i and j at the differentiation time t = I or J. ΔP I, J is further normalized for achieving a better visualization. B) Reduced 7 stages (“D1”–“D7”) for the differentiation process based on the combination and comparison of the hierarchical clustering trees of local and non‐local ΔP I, J established in (A). The chromosome within one stage thus possesses a relatively similar contact probability map. C) The change of the contact probability P(s) versus genomic distance s in the chromosome during differentiation with the 7 stages indicated at the bottom. D) Hi‐C heat (contact probability) maps of chromosome for the 7 stages during differentiation. E) Representative structures of the chromosome for the 7 stages during differentiation. (F–J) are similar with (A–E) except for the process of IMR90 reprogramming to ESC. Another reduced 7 stages during the reprogramming (“R1”‐“R7”) are determined in (G).
