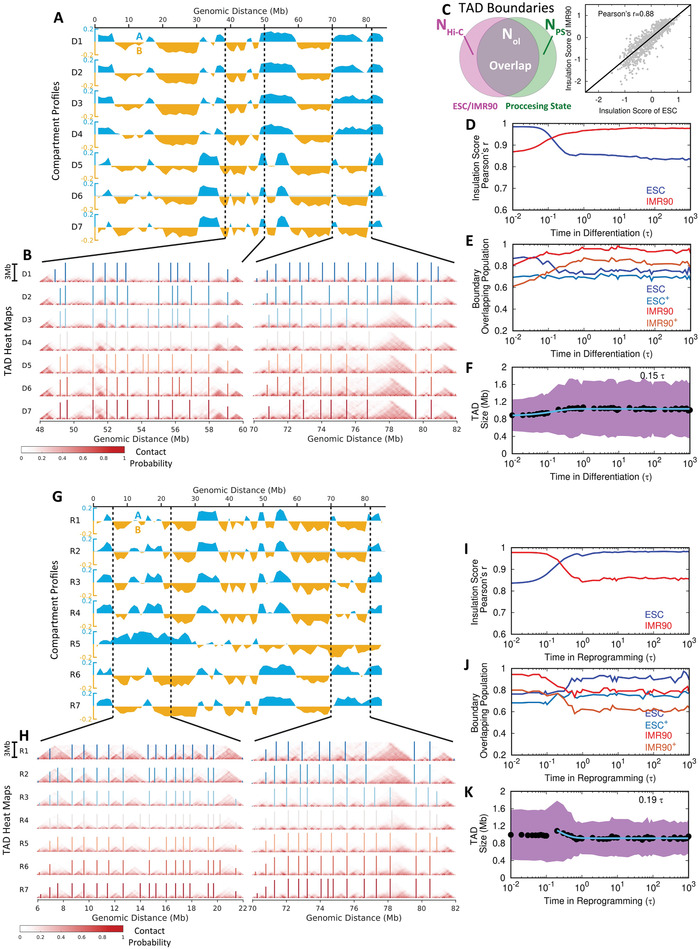
Figure 3.

Extensive switching of compartments A/B and conserved TADs in the chromosome during differentiation and reprogramming. A) Compartment profiles of the chromosome for the 7 stages during differentiation. The values of compartment profiles are defined as the first principal component (PC1) obtained by the principal component analysis (PCA) of the contact probability maps (details in Section 5). Compartments A and B are shown blue (positive) and yellow (negative) along with the whole range of the chromosome segment, respectively. B) Hi‐C heat (contact probability) maps of the two local regions of the chromosome that have compartment‐switching indicated in (A) for illustrating the structural changes of TADs at the 7 stages during differentiation. The boundaries of TADs are determined by the insulation score[ 44 ] and shown with vertical lines in the heat maps. C) An illustration of TAD boundary overlapping between Hi‐C data (ESC or IMR90) and simulation processing state during differentiation and reprogramming (left). The numbers of TAD boundaries detected by insulation score for experimental Hi‐C (ESC or IMR90), simulation processing state, and the overlap between processing state and Hi‐C (ESC or IMR90) are denoted as , N PS, and , respectively. Insulation scores obtained from the experimental Hi‐C data show high correlations between the ESC and IMR90 (right). D) The change of Pearson's correlation coefficient of the insulation score obtained from the simulation to the one from experimental Hi‐C of the ESC and IMR90 during differentiation. E) The change of TAD boundary overlapping population from the simulation processing state to the Hi‐C of the ESC and IMR90 (calculated by and ) and from the Hi‐C of the ESC and IMR90 to the simulation processing state (indicated by superscript + and calculated by and ) during differentiation. F) The change of the TAD size during differentiation. The data are fitted to exponential function with the relaxation time shown. Shadow region represents the standard deviations of the TAD size at the corresponding time. (G‐K) are similar to (A,B,D,E,F) except for reprogramming. The time shown in (K) is the relaxation time after passing the overexpansion stage.
