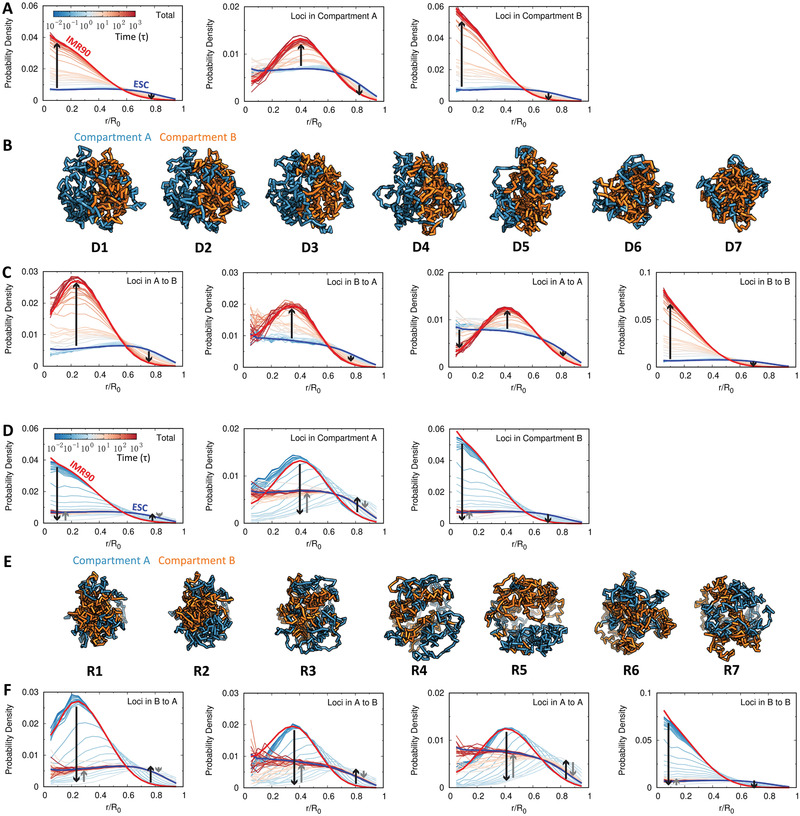
Figure 5.

The change of the radial density in the chromosome during differentiation and reprogramming. A) The change of the radial density profile for the whole loci (left), loci in compartment A (middle), and loci in compartment B (right) in the chromosome during differentiation. The profile at each state is colored by the processing time in the logarithmic scale, while the ones at the ESC and IMR90 are colored in blue and red, respectively. B) Structural illustrations of the chromosome with loci colored by compartment states during differentiation. C) The change of the radial density profile for particular groups of loci in the chromosome during differentiation. The chromosomal loci are classified into four groups based on their associated compartment‐switching patterns adapted during the differentiation, including dynamical switching of the compartment “A to B” and “B to A”, as well as the stable maintenance of the compartment “A to A” and “B to B” (left to right). The probability density is normalized by the number of loci involved. The lines with arrows illustrate the directions of changes in the radial density profile. (D–F) as (A–C) except for reprogramming. There are two types of lines with arrows in each figure for reprogramming. The black lines represent the expansion of the chromosome at the first stage, while the gray lines represent the compaction of the chromosome at the second stage.
