Figure 6.

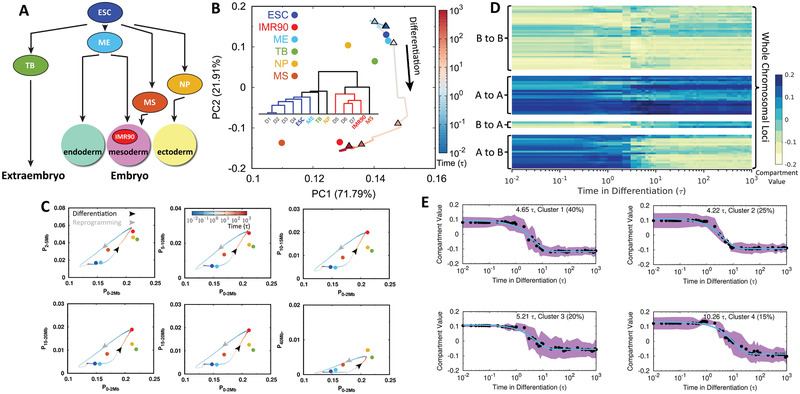
Bifurcation of the chromosomal structural rearrangement during differentiation. A) Scheme illustrating the ESC differentiation to the extraembryo and three germ layers in the embryo along with the experimental cell lines that are used for comparisons in our study. B) Principal component analysis (PCA) of chromosome compartment profiles during differentiation projected on the first two principal components (PCs) with populations indicated. Insert shows the hierarchical clustering tree of chromosome compartment profiles for the 7 stages in differentiation from the simulations and the experimental cell lines. C) Change of the contact probability in the chromosome during differentiation and reprogramming varied by different contact ranges. Time is in logarithmic scale and arrows indicated the directions of differentiation (black) and reprogramming (gray). Experimental cell lines are calculated from Hi‐C data indicated as points, in the same color scheme with those in (B). D) Compartmental value of individual chromosomal locus changing with respect to differentiation time. Chromosomal loci are classified into 4 groups based on their types of compartment‐switching in differentiation: A to B, B to A, A to A, and B to B (bottom to top). E) k‐means clustering (k = 4) of compartmental values changing with respect to time for loci that undergo compartment‐switching from A to B, corresponding to the group at the bottom in (D). The averaged compartmental value of loci changing with time in each cluster is fitted to exponential function and the corresponding relaxation time is shown. The percentage is the population of the corresponding cluster. The standard deviation is shown with the shadow region.
