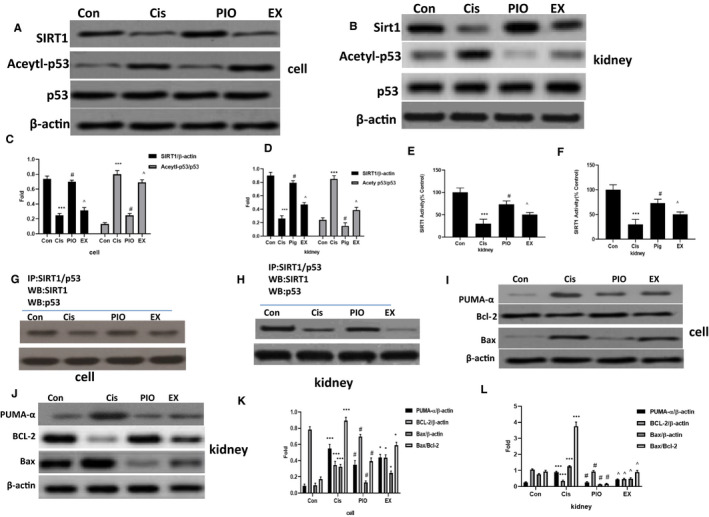
FIGURE 4.

The effect of PIO on SIRT1 activation, p53‐SIRT1 interaction and p53, PUMA‐α, Bcl‐2 and Bax in HK‐2 cells and mice kidneys after cisplatin treatment. A and B, Representative Western blot analysis strips for SIRT1, p53 and Acetylp53 in HK‐2 cells and mice kidneys after cisplatin treatment. C and D, Semi‐quantitative analysis of the relative amounts of SIRT1, p53 and Acetylp53 in HK‐2 cells and mice kidneys. E and F, The effect of PIO on SIRT1 activity in HK‐2 cells and mice kidneys after cisplatin treatment. G and H, Representative co‐immunoprecipitation analysis of p53‐SIRT1 interactions in HK‐2 cells and mice kidneys after cisplatin treatment. I and J, Representative Western blot analysis strips for PUMA‐α, Bcl‐2 and Bax in HK‐2 cells and mice kidneys after cisplatin treatment. K and L, Semi‐quantitative analysis of the relative amounts of PUMA‐α, Bcl‐2 and Bax in HK‐2 cells and mice kidneys. Bars represent the mean ± SEM (n = 10). *** P < .001, (Cis vs Con); # P < .05 (PIO vs Cis); ^ P < .05 (EX vs PIO). Cis, cisplatin; Con, control; PIO, Pioglitazone; EX, EX527
