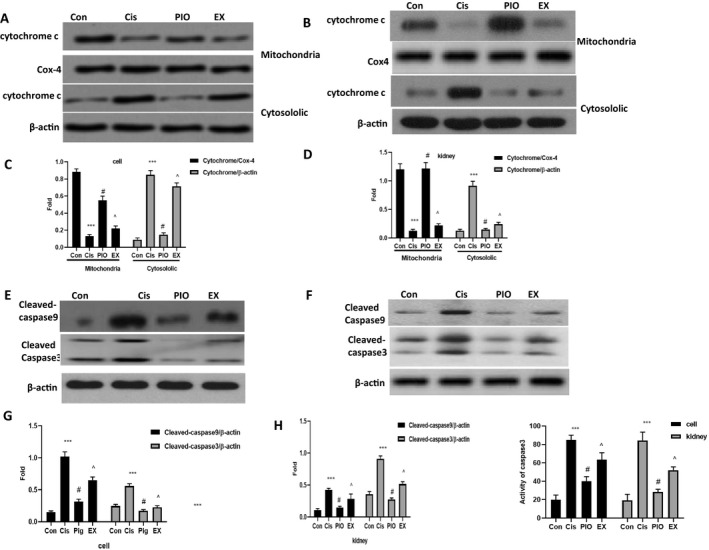
FIGURE 6.

The effect of PIO on the release of cytochrome c, and the activation of caspase‐3 and caspase‐9 in HK‐2 cells and mice kidneys after cisplatin treatment. A and C, Representative Western blot analysis strips for cytochrome c in mitochondrion and the cytoplasm in HK‐2 cells and mice kidneys after cisplatin treatment. B and D, Semi‐quantitative analysis of the relative amounts of cytochrome c in mitochondrion and the cytoplasm in HK‐2 cells and mice kidneys. E and F, Representative Western blot analysis strips for cleaved‐caspase‐3 and cleaved‐caspase‐9 in HK‐2 cells and mice kidneys after cisplatin treatment. G and H, Semi‐quantitative analysis of the relative amounts of cleaved‐caspase‐3 and cleaved‐caspase‐9 in HK‐2 cells and mice kidneys. I, The effect of PIO on caspase‐3 activity in HK‐2 cells and mice kidneys after cisplatin treatment. Bars represent the mean ± SEM (n = 10). *** P < .001, (Cis vs Con); # P < .05 (PIO vs Cis); ^ P < .05 (EX vs PIO). Cis, cisplatin; Con, control; PIO, Pioglitazone; EX, EX527
