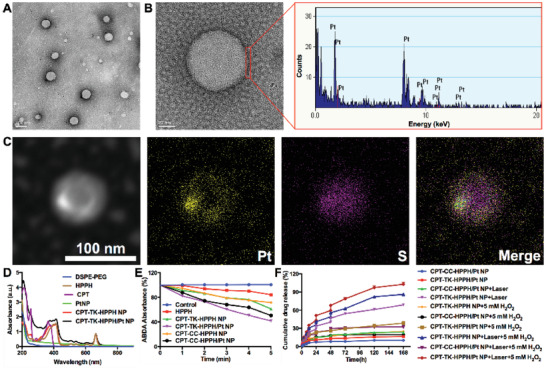
Figure 2.

Characterization of CPT‐TK‐HPPH/Pt NP. A) TEM image (scale bar: 100 nm), B) magnified TEM image (scale bar: 20 nm) and energy dispersive X‐ray spectroscopy of the local area of a CPT‐TK‐HPPH/Pt NP, C) dark‐field TEM image and corresponding TEM elemental mappings of the Pt and S signals of CPT‐TK‐HPPH/Pt NP (scale bar: 100 nm). D) UV–vis absorbance spectra of DSPE‐PEG, HPPH, CPT, PtNP, CPT‐TK‐HPPH NP, and CPT‐TK‐HPPH/Pt NP, E) ABDA absorbance of control, HPPH, CPT‐TK‐HPPH NP, CPT‐TK‐HPPH/Pt NP, CPT‐CC‐HPPH NP, and CPT‐CC‐HPPH/Pt NP groups, F) release behavior of CPT‐TK‐HPPH NP, CPT‐TK‐HPPH/Pt NP, and CPT‐CC‐HPPH/Pt NP under different conditions. Data in (D) and (E) are presented as mean ± SD (n = 3).
