
Figure 7.
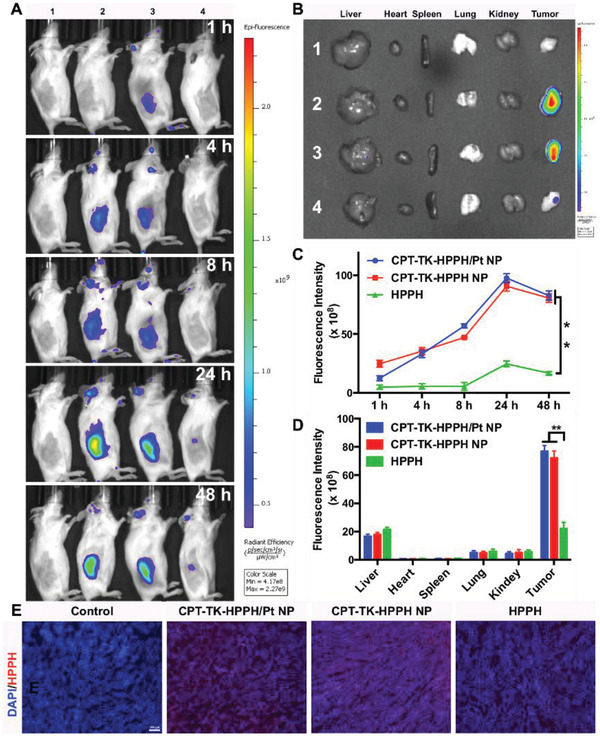
A) In vivo time‐dependent fluorescence image of tumors in CT26 tumor‐bearing mice. B) In vitro imaging of the livers, hearts, spleens, lungs, kidneys, and tumors excised from CT26 tumor‐bearing mice after 48 h (1. Control group, 2. CPT‐TK‐HPPH/Pt NP, 3. CPT‐TK‐HPPH NP, 4. HPPH). Quantitative fluorescence intensity of C) in vivo and ex vivo tumor tissues measured by RIO value. D) Fluorescence images of ex vivo tissues (blue channel: DAPI, red channel: HPPH, scale bar: 100 µm). All quantitative data are presented as mean ± SD (n = 3). “**” means the P < 0.01.