Figure 2.

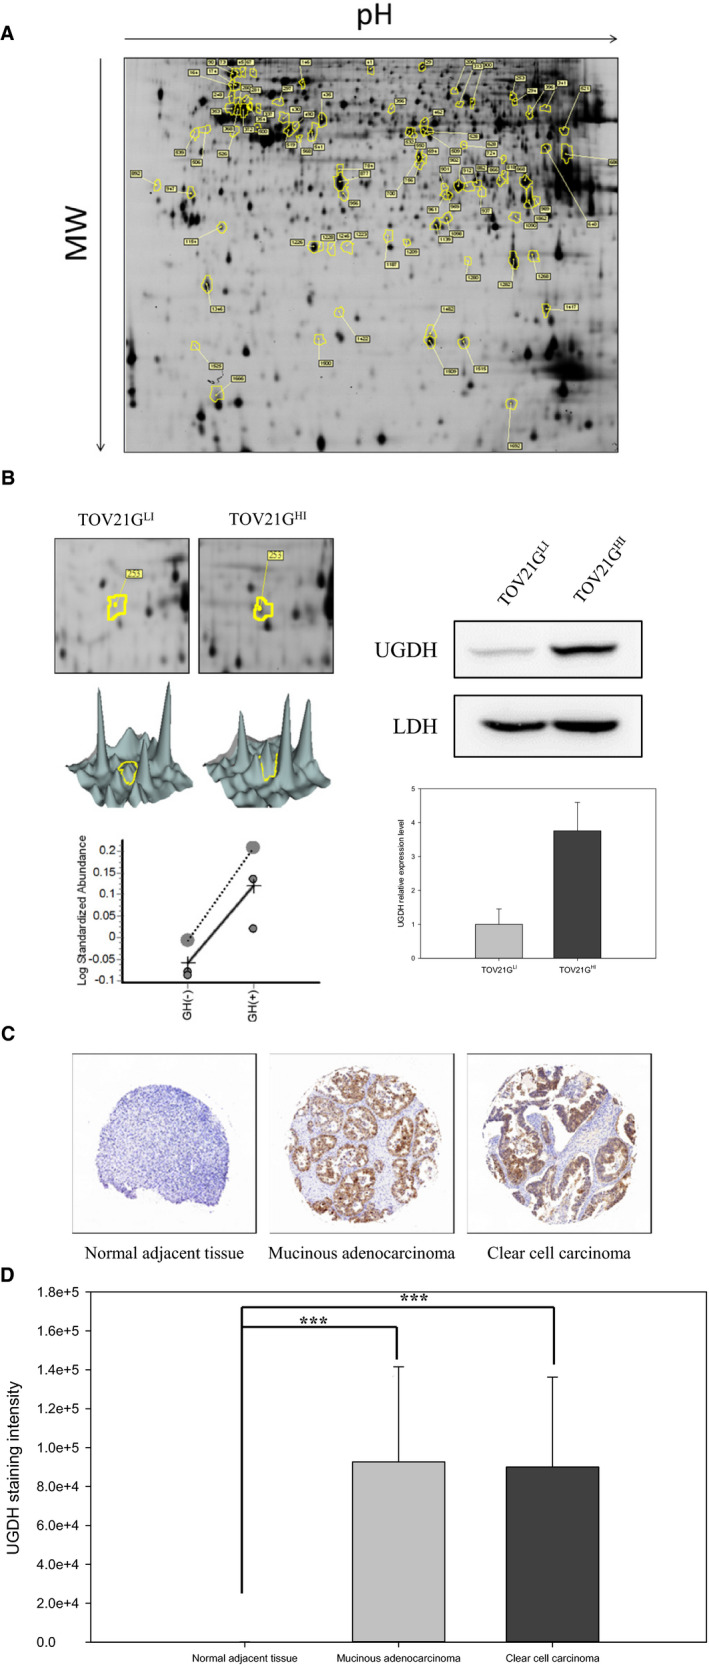
Proteomic analysis of metastasis‐related proteins and UGDH expression level in clinical tissue specimens of ovarian cancer. A, TOV21GLI and TOV21GHI cells were subjected to the 2D‐DIGE analysis. The results of 2D‐DIGE images were analysed by using DeCyder™ software; differentially expressed identified proteins with greater than 1.5‐fold or lower than −1.5‐fold differences are annotated with circles and spot numbers. B, Left panel: Up‐regulation of UGDH in TOV21GHI cells was observed in the 2D image, 3D image, and statistical data from the analysis of DeCyder™ software. Right panel: Expression levels of UGDH in TOV21GLI and TOV21GHI cells were validated by immunoblotting. The relative expression level of UGDH was quantified by ImageQuant software and normalized with the expression of LDH. Data are represented as the mean ± SEM. **, P < .01 compared to the expression level of UGDH in TOV21GLI cells. C, Expression level of UGDH in tissue microarray was monitored by immunohistochemical staining. The representative images show the expression level of UGDH in normal adjacent tissue, mucinous adenocarcinoma and clear cell carcinoma. D, UGDH expression intensities in normal adjacent tissue (n = 10), mucinous adenocarcinoma (n = 12) and clear cell carcinoma (n = 5) were analysed by ImageJ software. The diagram represents the staining intensity of the clinical tissue samples. Data are represented as the mean ± SEM. ***, P < .001 compared to the malignant tumour group
