
Figure 3.
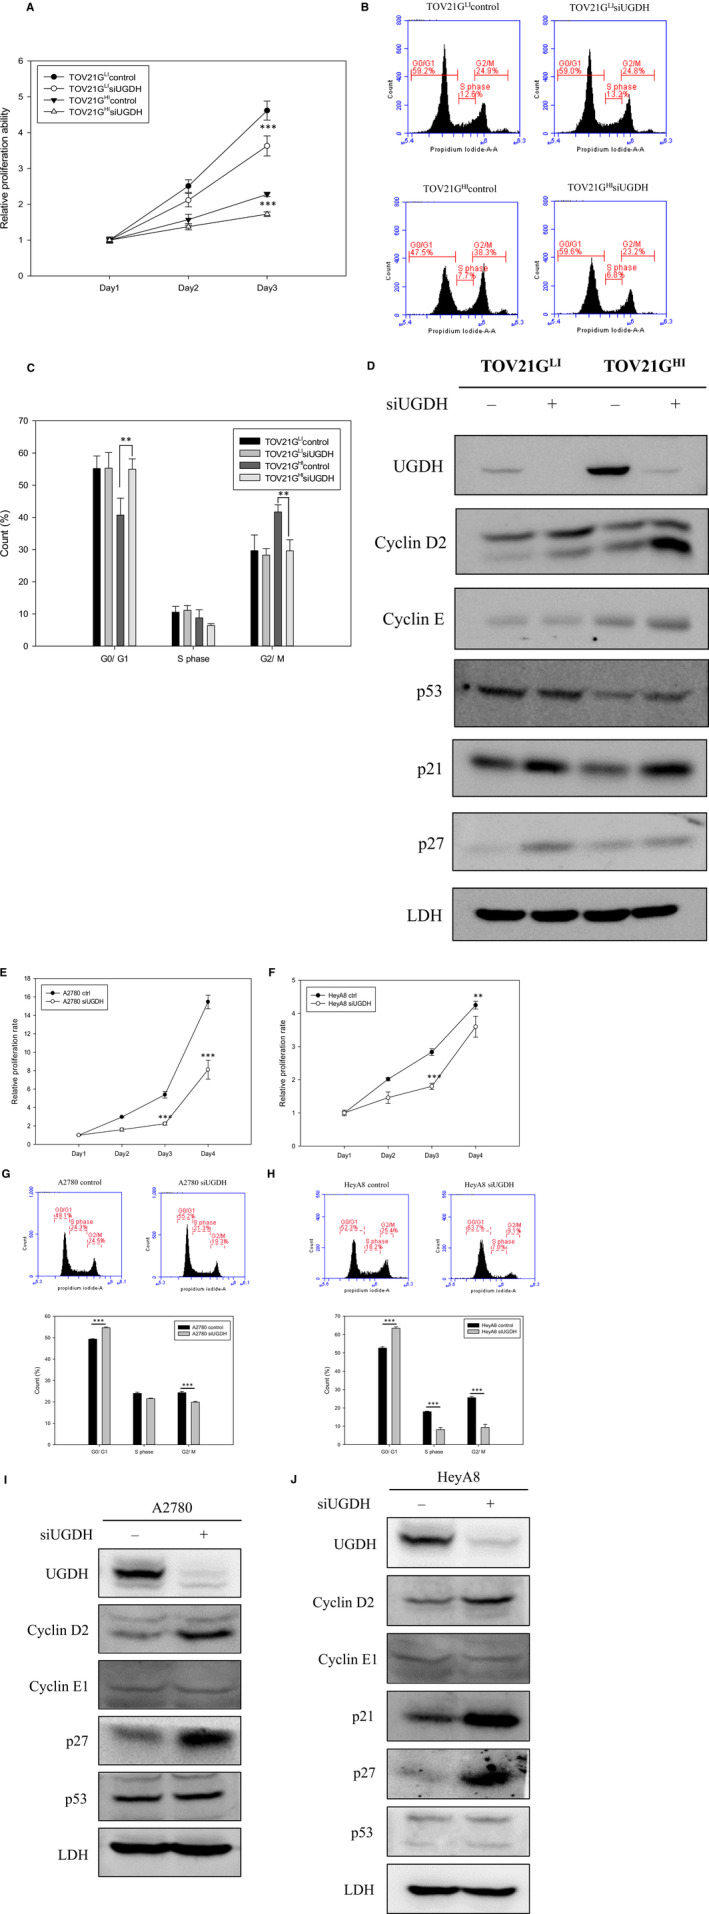
Deficiency of UGDH by siRNA inhibited cell proliferation and led to cell cycle arrest. A, Cell proliferation rates of TOV21GLI and TOV21GHI cells were monitored from days 1 to 3 after the treatment with siUGDH by MTT assay. The absorbance at days 2 and 3 was normalized to that at day 1. Data are presented as the mean ± SEM. ***, P < .001 compared to control ovarian cancer cells. B, Representative diagrams of cell cycle of control and siUGDH‐treated cells analysed by CFlow software. siUGDH‐treated TOV21GLI and TOV21GHI cells and control cells were stained with PI and applied to analyse DNA content by flow cytometry. The distribution of cell cycle phases (G0/G1, S, G2/M) is shown as indicated. C, Numbers of cells at the different cell cycle stages were statistically analysed and graphed. Data derived from three independent experiments are presented as the mean ± SEM. **, P < .01 compared to control cells. D, Expression levels of cell cycle regulatory proteins were monitored in response to siUGDH treatment. Immunoblotting was used to detect the expression level of cyclin D2, cyclin E, p53, p21 and p27 proteins in control and siUGDH‐treated TOV21G cells. Immunoblotting results of the indicated proteins were quantified by ImageJ and normalized to LDH. Cell proliferation assay via MTT assay was performed to analyse the effect of siUGDH on A2780 and HeyA8 cells (E), (F). siUGDH‐treated cells were monitored to assess the proliferation rates from days 1 to 4 by MTT assay. Data are presented as the mean ± SEM. **, P < .05; ***, P < .001 compared to control ovarian cancer cells. G, H, Representative plots of cell cycle analysis of A2780, HeyA8 and their siUGDH‐treated partners. I, J, Immunoblotting was performed to detect the expression levels of cyclin D2, cyclin E1, p21, p27 and p53 in A2780, HeyA8 and UGDH knockdown partners