Figure 1.

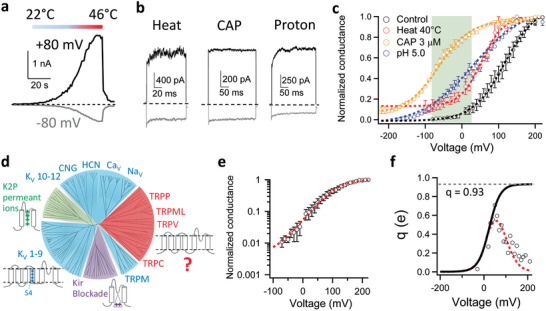
Voltage activation of TRPV1. a,b) Transmembrane voltage strongly modulates TRPV1 activities as shown in representative inside‐out patch recordings of a) TRPV1 activated by a heat ramp, b) high temperature at 42°C, 1 × 10⁻⁶ m capsaicin (CAP) or pH 5.0. Current traces recorded at depolarizing (+80 mV) and hyperpolarizing (−80 mV) voltages are in black and gray, respectively. c) Conductance–voltage (G–V) curve of TRPV1 (black: V 1/2 = 114.9 ± 1.2 mV, apparent gating charge (q app) = 0.72 ± 0.06 e0, n = 4) was shifted to more hyperpolarized voltages in the presence of an activation stimulus (red, heat at 40°C: V 1/2 = 54.8 ± 9.8 mV, q app = 0.94 ± 0.20 e0, n = 3; Blue, extracellular pH 5.0: V 1/2 = 33.4 ± 7.6 mV, q app = 0.46 ± 0.03 e0, n = 4; Orange, CAP at 3 × 10⁻⁶ m: V 1/2 = −72.3 ± 2.3 mV, q app = 0.79 ± 0.19 e0, n = 4.). G–V curves are fitted to a single‐Boltzmann function (dash curves). Note that with CAP and heat, the G–V curves approach a steady‐state level around 0.1 at deeply hyperpolarized voltages. Shaded in green is the physiologically relevant membrane potential range, in which voltage exhibits a strong influence on channel activity. Conductances were normalized to the maximum conductance measured at the highest depolarization voltage. d) A rootless phylogenetic tree representing channels within the VGL ion channel superfamily. Sections in blue, green and purple cover channels with a known voltage‐sensing mechanism. Adapted with permission.[ 13 ] Copyright 2004, The American Association for the Advancement of Science. e) Semilogarithmic plot of the voltage dependence of normalized mean conductance measured from steady‐state current in whole‐cell recordings. Then this plot was fitted with a smoothing function (dashed line in red) as described in Methods (Supporting Information with the parameters V 1/2 = 107.99 mV, q app = 0.72 e0 and base = 0.004.) This smoothing function (dashed line in red in Figure 1e) was then used to calculate q a according to the Equation S3 in the Methods in Supporting Information. f) The voltage dependence of the derivative of mean log open probability. The q a from the smoothing function was then plotted versus voltage in Figure 1f as the dashed line in red. Then the foot of q a(smoothing function)–V curve was fitted with Equation S4 in the Methods in Supporting Information to estimate the total gating charge, with the parameters q 0 = 0.002 e0 and q 1 = 0.928 e0. The total gating charge was estimated to be 0.93 e0. All statistics are given as mean ± s.e.m.
