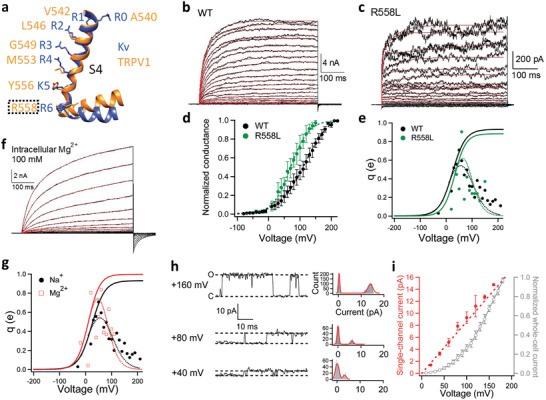
Figure 2.

None of the three classic voltage‐sensing mechanisms appears applicable to TRPV1. a) Structural alignment of the S4 helixes in TRPV1 (Orange; PDB ID: 5IRZ) and Kv 1.2–2.1 chimera channel (Blue; PDB ID: 2R9R). b,c) Representative whole‐cell recordings of wild‐type (WT) TRPV1 and its mutant R558L activated by depolarization with 10 mV increments from −80 to +220 mV and from −40 to +150 mV, respectively. The voltage activation time courses are well fitted to a double‐exponential function (red traces). d,e) G–V curves of WT (black) and R558L (green, V 1/2 = 71.4 ± 12.3 mV, q app = 0.96 ± 0.06 e0, n = 3.) in linear plot. e) The voltage dependence of the derivative of mean log open probability of WT (black) and R558L (green). Dashed curve is a Boltzmann smoothing function determined from fits to mean log open probability. Solid curve is a fit of the smoothing function with a Boltzmann function at voltages where the open probability is low. f) A representative whole‐cell recording with Mg2+ as permeating ions. The voltage activation time courses are well fitted to a double‐exponential function (red traces). g) The voltage dependence of the derivative of mean log open probability of WT measured with intracellular sodium ions (black) and magnesium ions (blue). Dashed curve is a Boltzmann smoothing function determined from fits to mean log open probability. Solid curve is a fit of the smoothing function with a Boltzmann function at voltages where the open probability is low. h) Representative single‐channel recordings from an inside‐out patch clamped at +40, +80, and +160 mV, respectively. To determine the single‐channel current amplitude, their corresponding all‐point histograms are fitted to a double‐Gaussian function (curves in red). i) Voltage dependence of single‐channel current amplitude (red) and macroscopic current recorded in the whole‐cell configuration (gray) (n = 3–5). All statistics are given as mean ± s.e.m.
