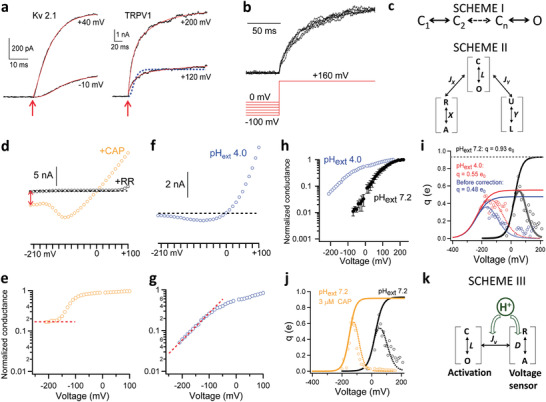
Figure 3.

Voltage‐sensing of TRPV1 involves the proton activation machinery. a) Voltage activation kinetics of Kv 2.1 channels exhibit an initial delay between depolarization (marked by an arrow in red) and the onset of macroscopic current. No such a delay was observed in voltage activation of TRPV1. The activation time course of Kv 2.1 is fitted to Equation S2, Supporting Information (based on SCHEME I in (c); also see Methods in Supporting Information), whereas a double‐exponential function is used to fit that of TRPV1 (solid curves in red). SCHEME I predicted the activation time course of TRPV1 shown by the dashed trace in blue. b) No Cole‐Moore shift was observed in voltage activation of TRPV1. No delay in current onset can be observed from macroscopic currents recorded at +160 mV after a 2 s prepulse from 0 mV to −100 mV with 20 mV increments. c) Gating SCHEME I and II for voltage activation of Kv channels and TRPV1, respectively. d) A representative recording of the voltage dependence of TRPV1 in whole‐cell configuration in the presence of 10 × 10−6 m CAP. Orange circles represent the steady‐state current amplitude at the corresponding voltages. Leak current was measured from the same patch in the presence of ruthenium red (20 × 10−6 m) to block TRPV1 (black circles). Current through TRPV1 at −210 mV is indicated by a double‐arrow in red. A dashed line in black indicates the zero‐current level. e) Voltage dependence of the normalized conductance calculated from the recording in (d). A dashed line in red indicates a steady‐state level was reached at deeply hyperpolarized voltages beyond −160 mV. f) A representative recording of the voltage dependence of TRPV1 in whole‐cell configuration in the presence of extracellular pH 4.0. g) Voltage dependence of the normalized conductance calculated from the recording in (f). A dashed line in red indicates the conductance level kept decreasing at deeper hyperpolarization. h) The semilogarithmic plot for the voltage dependence of normalized mean conductance measured from steady‐state current in whole‐cell recordings at extracellular pH 4.0 and pH 7.2, respectively. i) The fits to the derivative of the mean log open probability at extracellular pH 4.0 and pH 7.2, respectively. For pH 4.0 condition, the averaged q values from three independent recordings were fitted, with the parameters V 1/2 = −106 mV, q app = 0.63 e0 and base = 0.04 for the dashed smoothing function and q 0 = 0.0007 e0 and q 1 = 0.55 e0 for the Boltzmann function to estimate the total gating charge (see Methods for details in Supporting Information). The total gating charge was estimated to be 0.55 e0.. Dashed curve is a Boltzmann smoothing function determined from fits to mean log open probability. Solid curve is a fit of the smoothing function with a Boltzmann function at voltages where the open probability is low. All statistics are given as mean ± s.e.m. j) The fits to the derivative of the mean log open probability with and without 3 × 10⁻⁶ m capsaicin, respectively. k) A gating scheme where the voltage‐ and H+‐dependent transition couples allosterically to channel opening.
