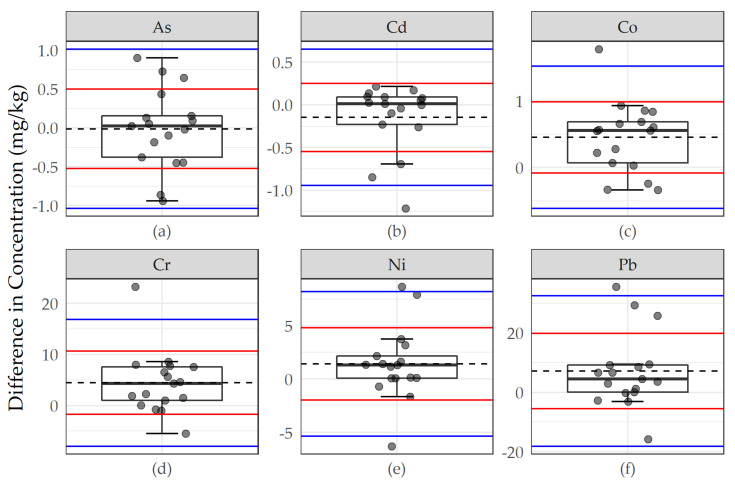
Figure 3.
Differences in concentration between youth scientists and expert replicates for (a) As, (b) Cd, (c) Co, (d), Cr, (e) Ni, and (f) Pb. Points represent paired differences, summarized by underlying boxplots. Dashed lines represent the mean paired difference between youth primary and expert replicate samples; red and blue lines represent “bounds of agreement” at ±1 and ±2 standard deviations, respectively, about the mean difference.

