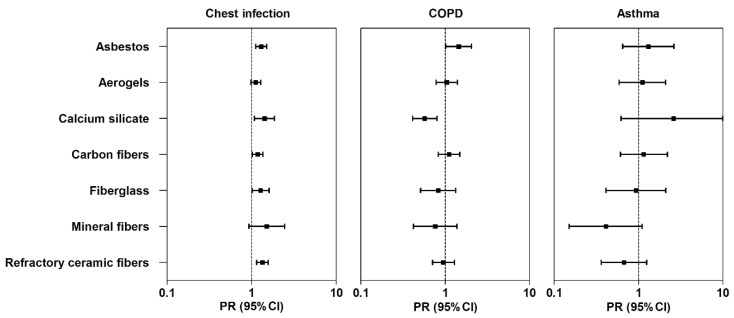
Figure 1.
Association between different occupational exposures at work and respiratory conditions in insulators. Figure legend: adjusted associations between occupational exposures and respiratory conditions in insulators. Boxes and the error bars indicate the prevalence ratios (PR) and 95% confidence intervals (95%CI), respectively. Multivariable models were adjusted for sex, age, education (3 categories: up to high school, trade school, and college or beyond), and smoking pack-years. Each row represents a single regression model.

