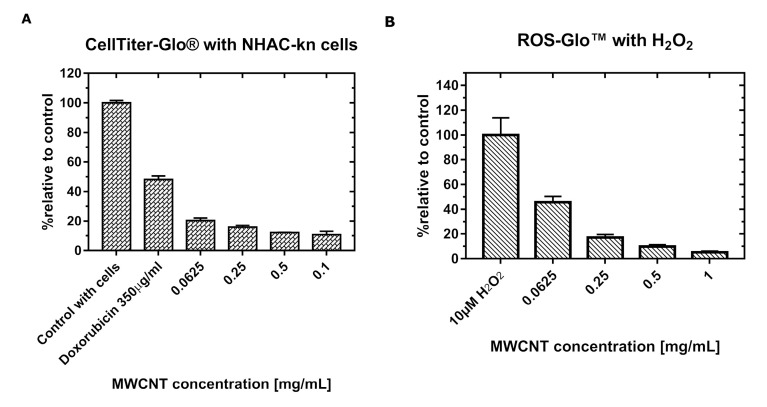
Figure 5.
The plots represent the relative production of reactive oxygen species (ROS) in NHAC-kn cells after 48 h incubation with MWCNT-Ox (A) and signal of luminescence measured with the same concentrations of H2O2 and various concentrations of MWCNTs-Ox (B). A strong decrease in the luminescent signal is visible with increasing amounts of carbon nanotubes.

