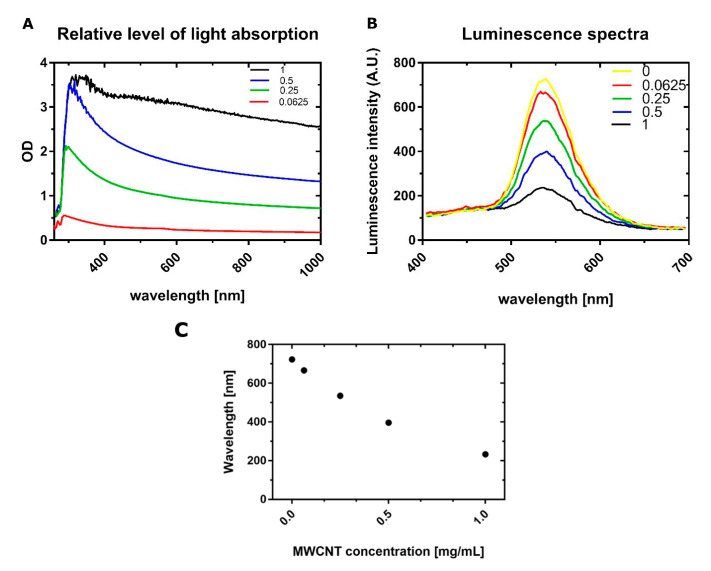
Figure 6.
The Absorption spectrum of MWCNT-Ox used for experiments is shown on the (A) plot. The curves correspond to the respective concentrations of MWCNT-Ox. The maximum absorption is visible around 300 nm; however, it is observed throughout the whole range. The (B) plot shows luminescence spectra generated by the firefly luciferase from the CellTiter Glo assay, with a peak at λ = 532 nm. With an increasing amount of MWNCTs, the signal intensity is diminishing. When comparing both spectra, there is a visible overlap, which may indicate that some of the generated luminescent signals may be absorbed. The (C) plot represents a trend of decreasing maximum luminescence intensities with increasing concentrations of MWCNTs.

