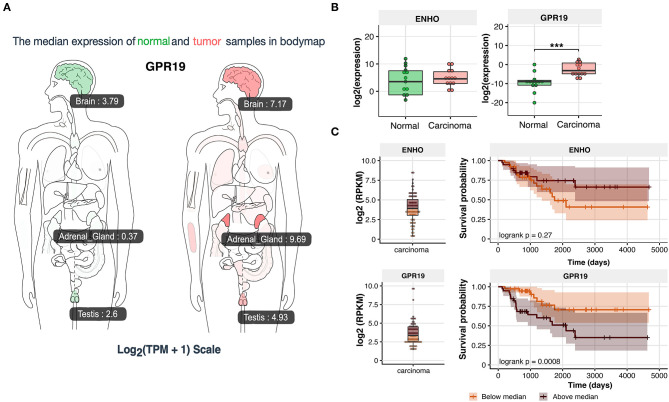
Figure 12.
Expression of ENHO and GPR19 in clinical samples. (A) Profile of GPR19 expression in normal and tumor samples from GEPIA (Gene Expression Profiling Interactive Analysis) database. (B) Expression of ENHO and GPR19 in normal and tumor samples of human adrenal gland. (C) Kaplan–Meier survival analysis of 92 cases of adrenocortical carcinoma obtained from TCGA database. Expression data for ENHO and GPR19 were divided into group with high (above median) and low expression (bellow median). Statistical differences were determined by the Mann–Whitney U non-parametric test compared to normal adrenals. ***p < 0.001.

