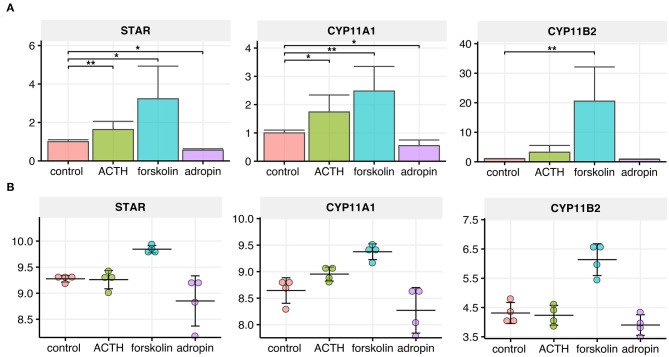
Figure 4.
Relative expression levels of CYP11A1, CYP11B2 and StAR genes in the HAC15 cell line after 24 h incubation with ACTH, forskolin, and adropin vs. controls (untreated cells). (A) Real time QPCR study (N = 4/group). Statistical differences were determined by the Mann–Whitney U non-parametric test compared to controls. *p < 0.05; **p < 0.01. (B) Normalized expression values extracted from the microarray data set (N = 4/group).

