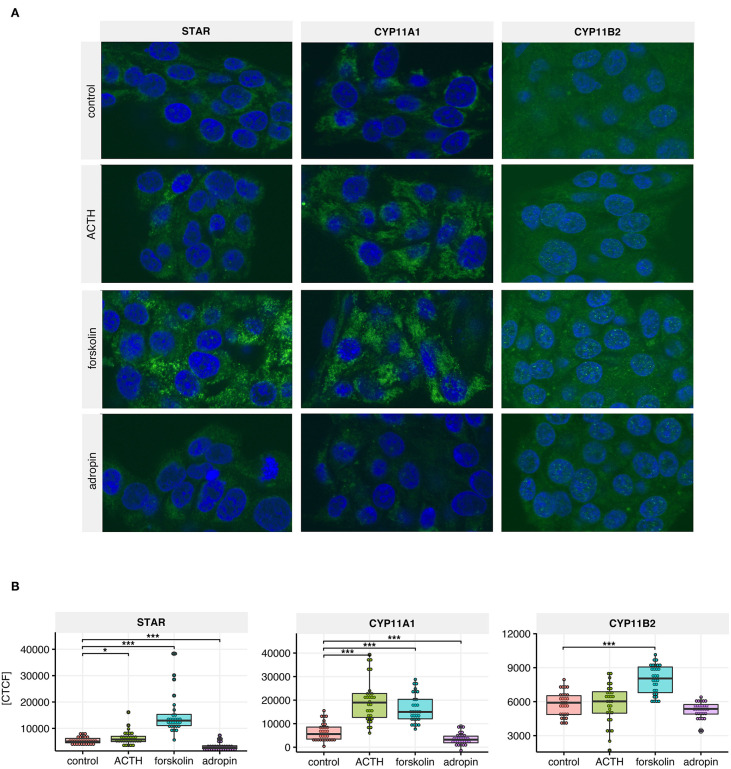
Figure 5.
StAR, CYP11A1, CYP11B2 immunoreactivity in untreated HAC15 cells (controls) and cells incubated with ACTH, forskolin and adropin for 24 h. (A) Representative images of the HAC15 cells from each group, where the positive reaction of antibody binding was visualized in green, while the cell nuclei were stained in blue with DAPI. (B) Densitometric analysis of the fluorescence intensity (N =3 0/group). Statistical differences were determined by the Mann–Whitney U non-parametric test compared to controls. *p < 0.05; ***p < 0.001. CTCF indicates corrected total cell fluorescence.

