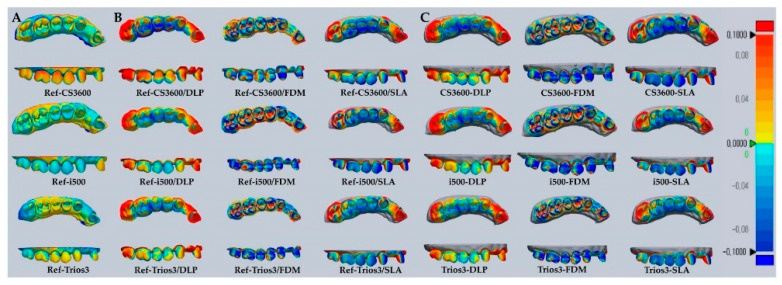
Figure 3.
Representative deviations of superimposition using a surface matching software on the 3D digital model. Range of deviation was color coded from −100 (blue) to +100 µm (red). (A) superimposition between Ref-IOS data. (B) superimposition between Ref-IOS/3DP data. (C) superimposition between IOS-3DP data.

