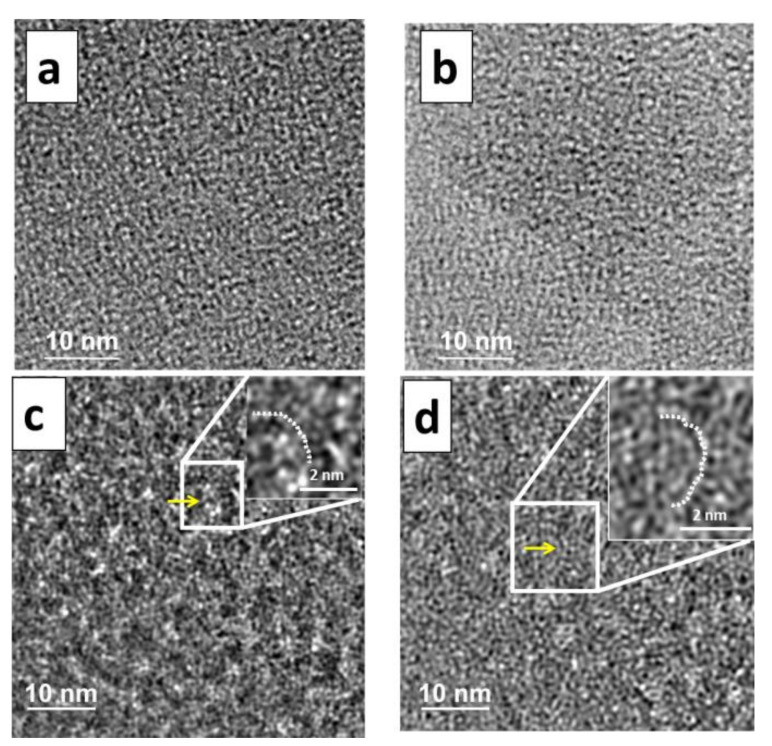
Figure 2.
High-resolution electron microscopy images of the a-silica compounds S1 (a), S2 (b), S3 (c), and S4 (d). The area inside the white rectangle has been enlarged to show the ring structure. Enlarged images are inserted for S3 (c) and S4 (d), in which the nanopore ring formations are marked with white dots. Yellow arrows within the white square area indicate a nanopore ring formation.

