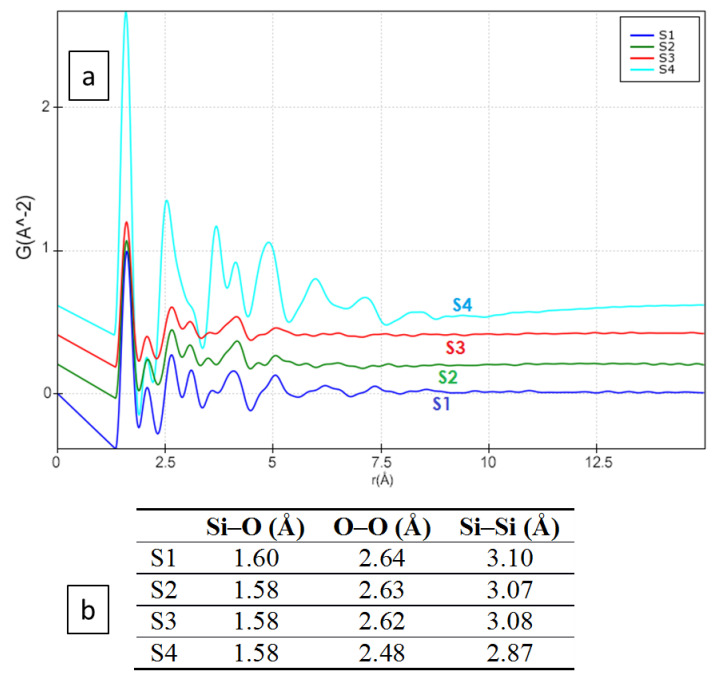
Figure 8.
(a) The calculated electron pair distribution function (e-PDF) from S1–S4, where the x-axis represents the interatomic distances in Å and the y-axis represents the probability (in arbitrary units) of finding two atoms at distance r. (b) Calculated of the peak position from the e-PDF analysis.

