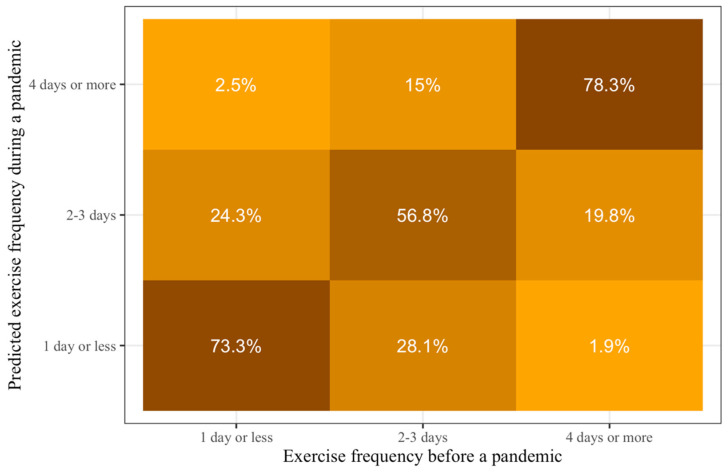
Figure 2.
Predictions of probabilities of exercise frequency during conditions similar to COVID-19 pandemic based on prepandemic exercise frequency. Lighter colors show smaller probabilities and darker colors show larger probabilities. The darkest colors are all on the diagonal from the bottom left to the top right, which means that people who exercise at a specific frequency before such pandemics would be most likely to exercise at the same frequency during it.

