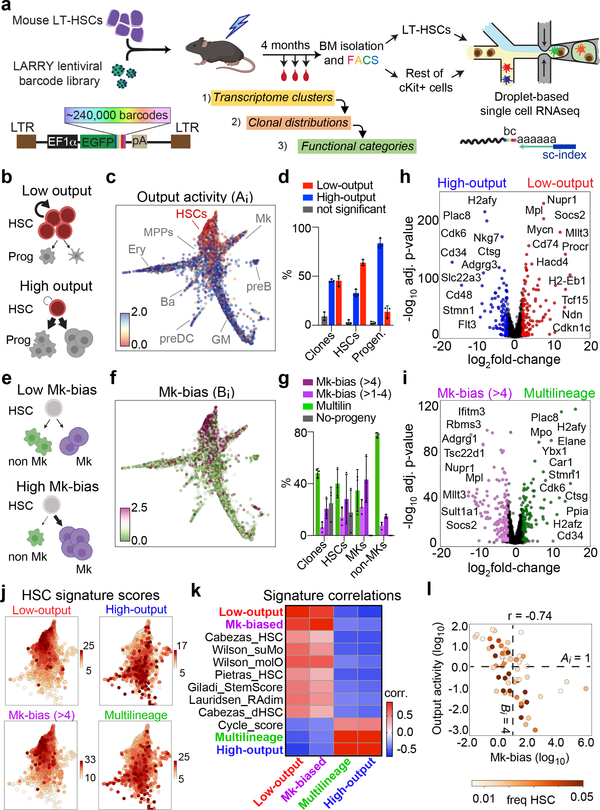
Figure 1. Simultaneous single cell lineage and transcriptome sequencing maps functional HSC heterogeneity.
a, Experimental design for studying HSC heterogeneity with the Lineage and RNA RecoverY (LARRY) lentiviral barcoding library. All panels are representative from n = 3 independent labeling experiments (5 mice). b, Schemes of low-output (top) and high-output (bottom) HSC clones. c, Single cell map showing clonal HSC output activity values. Major cell populations are labeled. d, Distribution of high-output (output activity >1) and low-output (output activity <1) HSC cells and clones (shown as % of total HSCs). Mean ± S.D. e, Schemes of lineage balanced (top) and biased (bottom) HSC clones. f, Single cell map showing clonal Mk-bias values. g, Distribution of Mk-biased and Multilineage HSCs (cells and clones), Mk cells and non-Mk cells (shown as % of total). Mean ± S.D. h, Genes differentially expressed in low-output (right, n = 7254 cells) versus high-output (left, n = 3512 cells) HSCs. Genes with adjusted p-value<0.01 (Benjamini-Hochberg-corrected t-test) and fold-change>2 are colored. Selected genes are labeled. i, Genes differentially expressed in Mk-biased (right, n = 3399 cells) versus Multilineage (left, n = 3771 cells) HSCs. Genes with adjusted p-value<0.01 (Benjamini-Hochberg-corrected t-test) and fold-change>2 are colored. j, Single cell map of HSCs, colored by signature score values. k, Heatmap showing the Pearson correlation between different signature scores across all HSCs (n = 10837). l, Scatter plot of Mk-bias and output activity (log-transformed) for each HSC clone, colored by clone HSC frequency. Dotted lines are the output activity threshold (Ai = 1), and the Mk-bias threshold (Bi = 4). Only clones with HSC frequency > 0.005 are depicted (n = 62).

