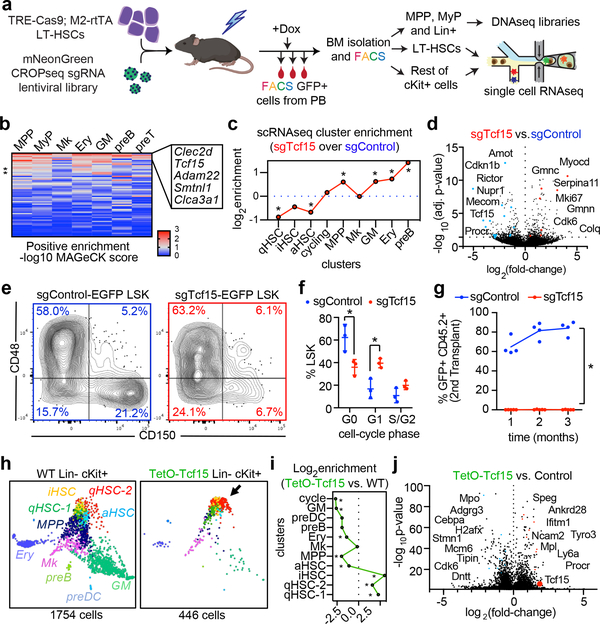
Figure 3. In vivo CRISPR screening identifies regulators of HSC output.
a, Experimental design for the steady state CRISPR screening. b, Heatmap showing positive enrichment score for each targeted gene (rows), in each BM compartment (columns). The top 5 genes are labeled. c, Single-cell cluster enrichment of sgTcf15 (log2fold over sgControl). *p<0.1 by differential proportion analysis (DPA) test (nsgTcf15=298, nsgControl=437). For DPA, see methods. d, Volcano plot showing differentially expressed genes comparing sgTcf15 (n=220) vs. sgControl (n=269) HSCs from the scRNAseq experiments. Benjamini-Hochberg-corrected t-test p-values are shown. e, FACS plots showing BM LSK staining for SLAM staining of donor-derived sgControl and sgTcf15 EGFP+ cells. Plots are representative from n=4 independent experiments. f, Quantification of cell cycle status of EGFP+ LSKs. Mean ± S.D. *p<0.005 (n=3, Holm-Sidak-corrected two-sided t-test). g, Quantification of donor engraftment (%EGFP+ of all PB cells) in secondary transplantation. *p<0.005 (n=4, Holm-Sidak-corrected two-sided t-test). h, SPRING single-cell RNAseq map of one representative experiment comparing wild-type (left) vs. Tcf15 overexpressing cKit enriched cells (right). i, Cluster enrichment of TetO-Tcf15 represented as log2fold-enrichment over control. *p<0.1 DPA test (nTetO-Tcf15=440, ncontrol=1752). j, Volcano plot showing differential gene expression of TetO-Tcf15 (n=446) vs. control cKit+ (n=1754) cells. Benjamini-Hochberg-corrected t-test p-values are shown.

