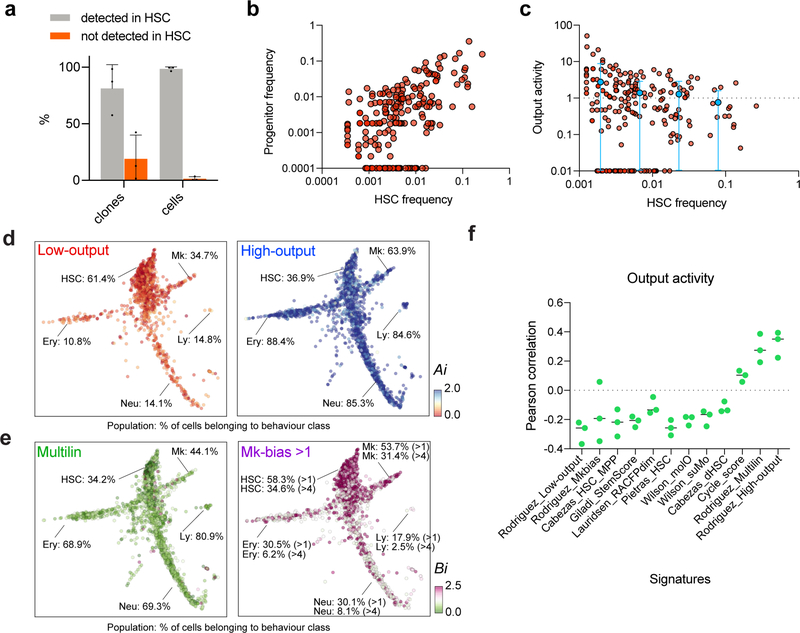
Extended Data Figure 2. Description of HSC heterogeneity according to their output activity and clone size.
a, Histogram showing % of cells (right) and % of clones (left) in progenitors that are not detected in HSCs (n=3 independent experiments). Whereas some clones are not detected in HSCs (orange bar, left), these are typically single cell clones and minimally contribute to progenitor cellularity (orange bar, right). pclones = 0.022 and pcells < 0.001. Holm-Sidak multiple-test corrected t-test. b, Scatter plot showing correlation between HSC clone size, hi (expressed as fraction of total HSCs in each experiment), and clonal output activity, ki (fraction of total progenitors), for each detected clone (data is pooled from 5 mice). Pearson correlation r = 0.59 (n=226 clones, from all 3 independent experiments). A pseudocount of 0.0001 is used for progeny frequency to display the zeros (clones with no output). c, Scatter plot showing HSC clone sizes and their range of differentiated output activity. Pearson correlation r = −0.097 (slope non-significantly different than zero, p=0.1449, n=226 clones). A pseudocount of 0.01 is used for output activity to display clones for which progeny is not detected. The binned average and range are shown in blue (HSC frequency bins are [0.0001–0.005], n=127, [0.005–0.01], n=33, [0.01–0.05], n=52 [0.05–1], n=14). d, Single cell maps showing the clonal HSC output activity values for each single cell. Low-output clones are shown on the left and high-output clones are shown on the right. For each population (HSCs, Mk, Ery, Ly and Neu), the percentage of cells that belongs to clones of the indicated behavior class is shown. Scale range, 0 (red) to 2 or more (blue). Plotted single cells are randomly subsampled (n=2000) without replacement. e, Single cell maps showing the clonal HSC Mk-bias values for each single cell. Non-biased multilineage clones are shown on the left and Mk-biased (bias>1) clones are shown on the right. For each population (HSCs, Mk, Ery, Ly and Neu), the percentage of cells that belongs to clones of the indicated behavior class is shown. Scale range, 0 (green) to 2.5 or more (pink). Plotted single cells are randomly subsampled (n=2000) without replacement. f, Pearson correlation between the output activity and the average signature score of each clone, for different computed signatures as in Figure 1. Black bars indicate mean of 3 independent experiments.

