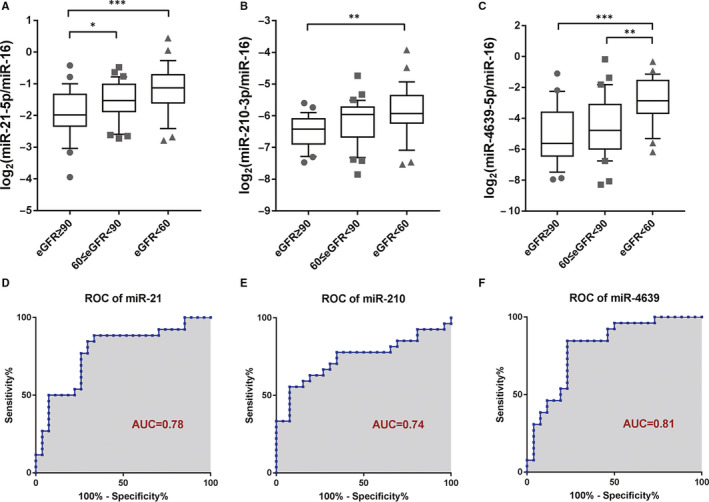
FIGURE 4.

Discrimination of eGFR level by exosomal miRNA expression. A‐C, Relative expression levels of miR‐21‐5p, miR‐210‐3p and miR‐4639‐5p in participants with different eGFR levels. Boxes represented the interquartile range of the data. The lines across the boxes and the numbers indicated the median values. The hash marks above and below the boxes indicated the 90th and 10th percentiles for each group, respectively. eGFR ≥ 90 (mL/min/1.73 m2): n = 26; 60 ≤ eGFR <90 (mL/min/1.73 m2): n = 33; eGFR < 60 (mL/min/1.73 m2): n = 26. D‐F, ROC curve analysis of exosomal miR‐21‐5p, miR‐210‐3p and miR‐4639‐5p in distinguishing subjects with eGFR < 60 (mL/min/1.73 m2) from those with eGFR ≥ 90 (mL/min/1.73 m2). eGFR, estimated glomerular filtration rate; ROC curve, receiver operating characteristic curve; AUC, area under the curve. *P < .05, **P < .01, ***P < .001
