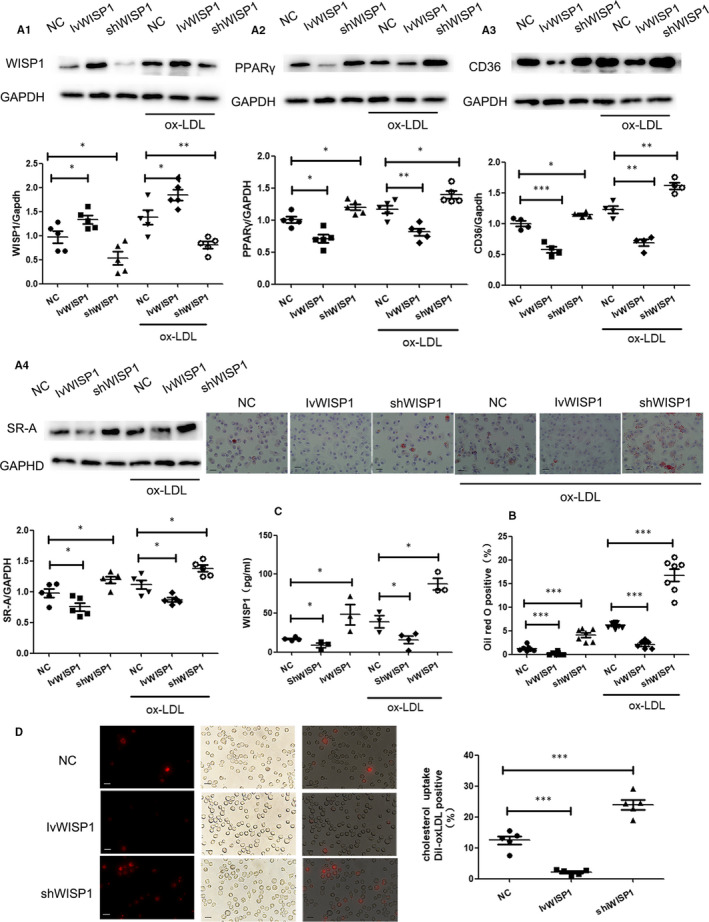
Figure 6.

Down‐regulation of WISP1 can accelerate lipid deposition in macrophages. A: Western blot analysis of WISP1 (A1), PPARγ (A2), CD36 (A3) and SR‐A (A4) in macrophages. B: Representation Oil Red O staining of macrophage (scale bar: 25 μm, n = 7‐9). C: Wisp1 content in cell supernatant. D: Representative image of fluorescently labelled oxidized low‐density lipoprotein (Dil‐ox‐LDL) uptake in macrophages (scale bar: 25 μm, n = 5) (*P < .05, **P < .01, ***P < .001; data are means ± SD). NC: null lentivirus, IvWISP1: lentivirus WISP1, shWISP1: WISP1‐shRNA
