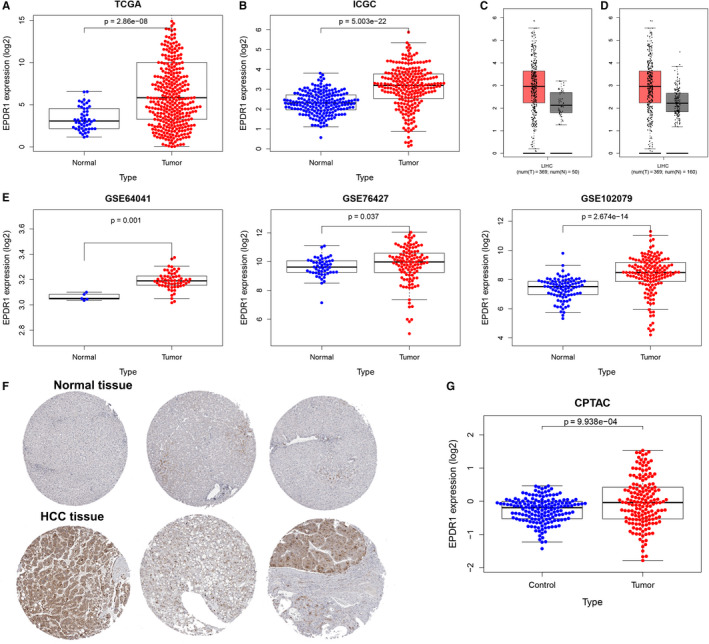
Figure 1.

EPDR1 expression in HCC. EPDR1 expression in HCC tissues compared with normal tissues using TCGA database (A) and ICGC database. (B) EPDR1 expression in HCC tissues compared with normal tissues (C) or normal and GTEx data (D) using the GEPIA database. (E) EPDR1 expression in HCC tissues compared with normal tissues using the GEO database. (F) The protein levels of EPDR1 in HCC from HPA database and CPTAC database (G)
