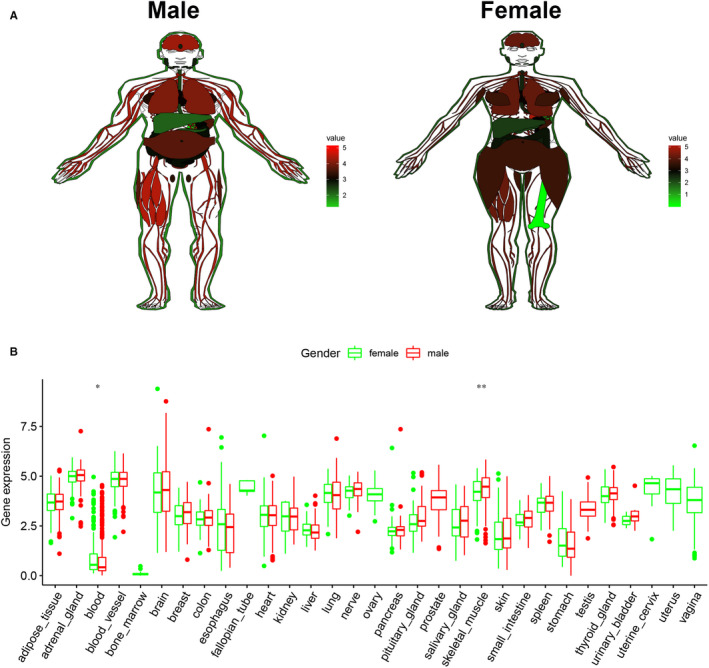
Figure 4.

Expression level of EPDR1 in normal human tissues based on the GTEx data. (A) Expression of EPDR1 in male and female tissues. Red represents high expression, black represents median expression, and green represents low expression. (B) Comparative analysis of EPDR1 expression level between male and female tissues
