
FIGURE 4.
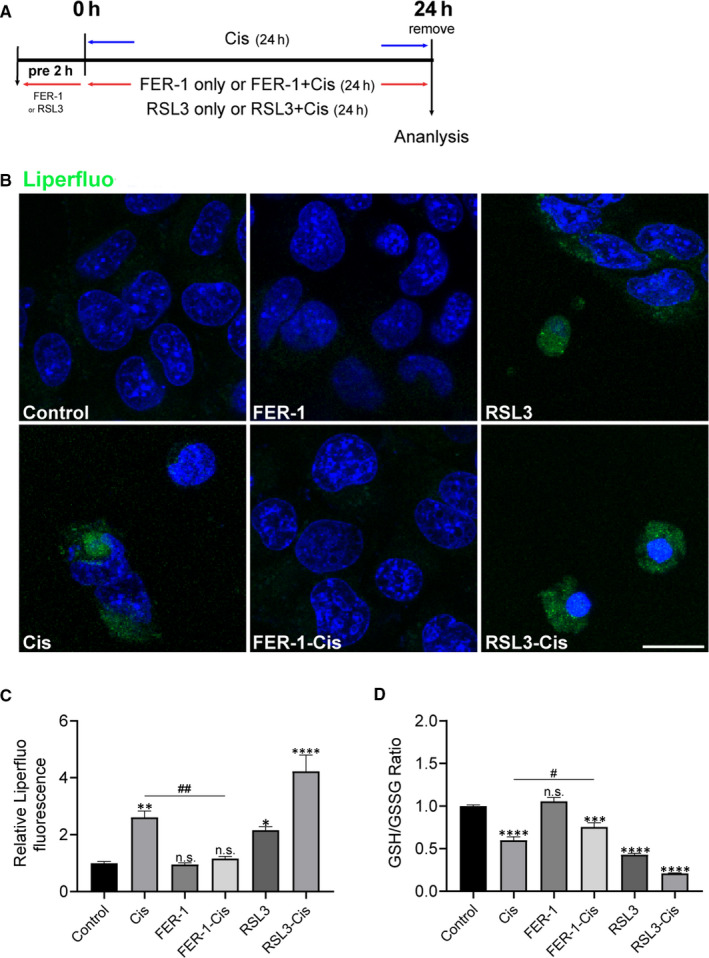
Effects of ferrostatin‐1 (FER‐1) on lipid reactive oxygen species (ROS) production and ratio of glutathione (GSH) and glutathione disulphide (GSSG) in cisplatin‐damaged House Ear Institute‐Organ of Corti 1 (HEI‐OC1) cells. A, The experimental workflow. The HEI‐OC1 cells were pre‐treated with 3 μmol/L RSL3 or 30 μmol/L FER‐1 for 2 h and then treated with or without 30 μmol/L cisplatin for another 24 h, or treated with 30 μmol/L cisplatin alone for 24 h, and then lipid ROS was detected by Liperfluo. B, Representative images of Liperfluo staining. Scale bar, 20 µm. C, The fluorescence intensity was quantified by ImageJ software. The data are shown as mean ± SEM. of three independent experiments. *P < 0.05, **P < 0.01, ****P < 0.0001 and n.s. no significant vs the control group; ## P < 0.01 vs the cisplatin group. D, GSH/GSSG assay. The data is shown as mean ± SEM. of three independent experiments. ***P < 0.001, ****P < 0.0001 and n.s. no significant vs the control group; # P < 0.05 vs the cisplatin group