
Figure 1.
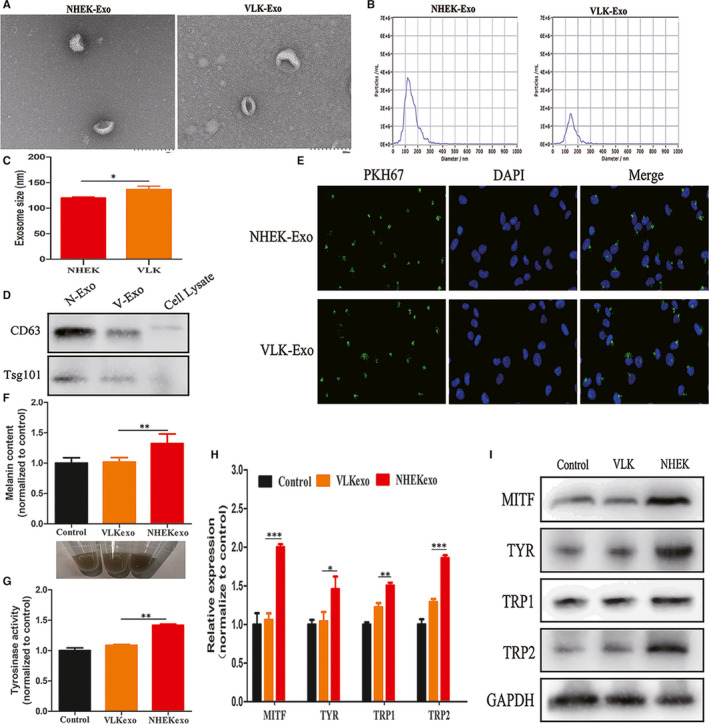
Exosomes characterization, uptake and their effects on the regulation of melanogenesis. A, The morphology of NHEK‐Exo and VLK‐Exo observed by transmission electron microscope (TEM) (Scale bars, 200 nm). B, Exosomes size distribution measured by nanoparticle tracking analysis (NTA). C, Statistical analysis of exosome size between NHEK and VLK (P < 0.05). D, Western blot analysis of exosome specific surface markers (CD63, TSG101) in NHEL‐Exo, VLK‐Exo and cell lysate. E, IFM analysis of the interaction of PKH67‐labelled (green) exosomes from NHEK or VLK with melanocytes labelled for DAPI (blue). (F and G) Melanin content, cell pellets and tyrosinase activity in melanocytes cocultured with NHEK‐Exo or VLK‐Exo for 72 h. Melanocytes cocultured with PBS were used as a control. (H and I) Analysis by qRT‐PCR and Western blot on the expression of MITF, TYR, TRP1 and TRP2 in melanocytes cocultured with NHEK‐Exo or VLK‐Exo for 72 h. Melanocytes cocultured with PBS were used as a control. Results are expressed as mean ± SD (n = 3). *P < 0.05, **P < 0.01, ***P < 0.005