
FIGURE 3.
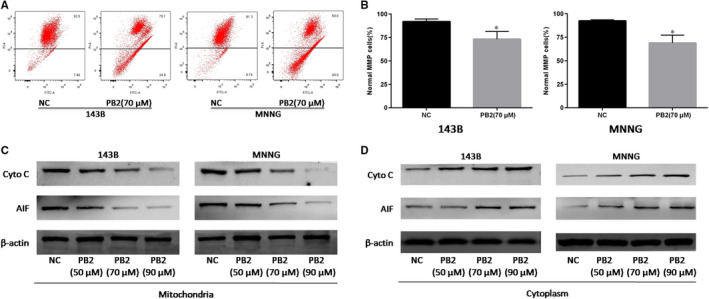
Effects of PB2 on mitochondrial membrane permeability in OS cells. A,B, The MMP of 143B and MNNG cells with or without PB2 treatments determined by JC‐1 using flow cytometry (n = 3, * P < .05 for PB2 vs NC). C,D, Expression of cyto‐C and AIF in mitochondria and cytoplasm of 143B and MNNG cells was determined by Western blotting