Figure 1.

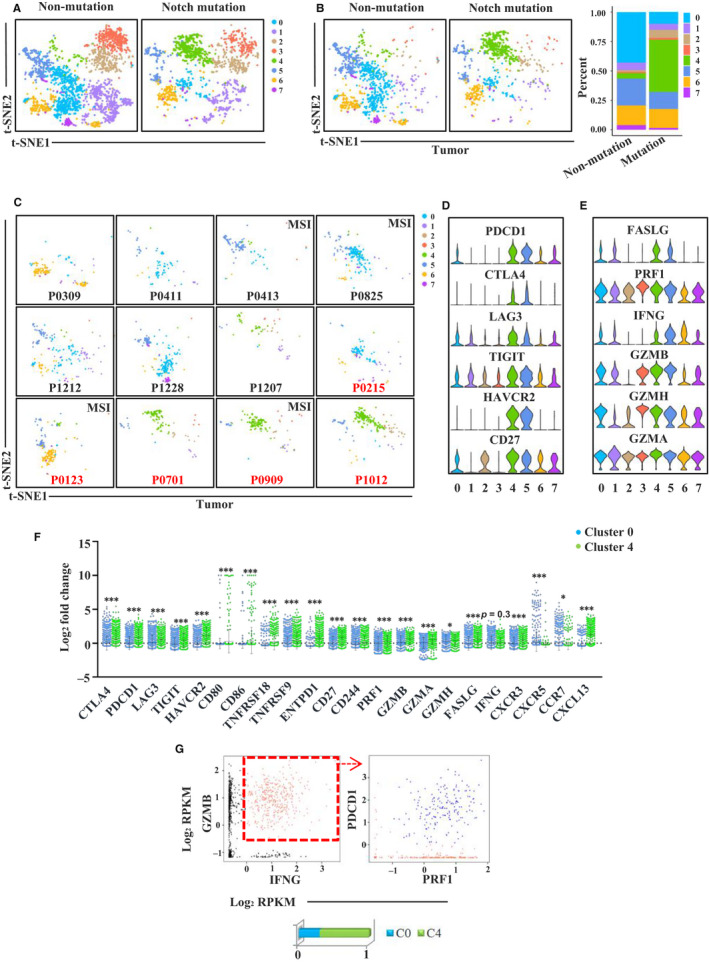
Gene expression profiles of CD8+ T cells in GSE108989 single T cell sequencing data set. A, t‐SNE plot of CD8+ T cells from Notch signalling pathway mutation and non‐mutation patients. B, t‐SNE and proportion plots of CD8+ T cells derived from tumour microenvironment between Notch signalling pathway mutation and non‐mutation patients. C, t‐SNE plot of CD8+ T cells derived from tumour microenvironment of each patient. Patients in red are Notch signalling pathway mutation ones. D, Violin plots showing normalized expression of immune checkpoint molecules in CD8+ T cell clusters. E, Violin plots showing normalized expression of cytotoxic related molecules in CD8+ T cell clusters. F, The expression of immune checkpoints, effector molecules and chemokines and chemokine receptors in cluster 0 and cluster 4 (*P < 0.05, ***P < 0.001, tested by Mann‐Whitney U test). G, Proportions of cells co‐expressing GZMB, IFNG, PRF1 and PDCD1 in clusters 0 and 4
