Figure 2.

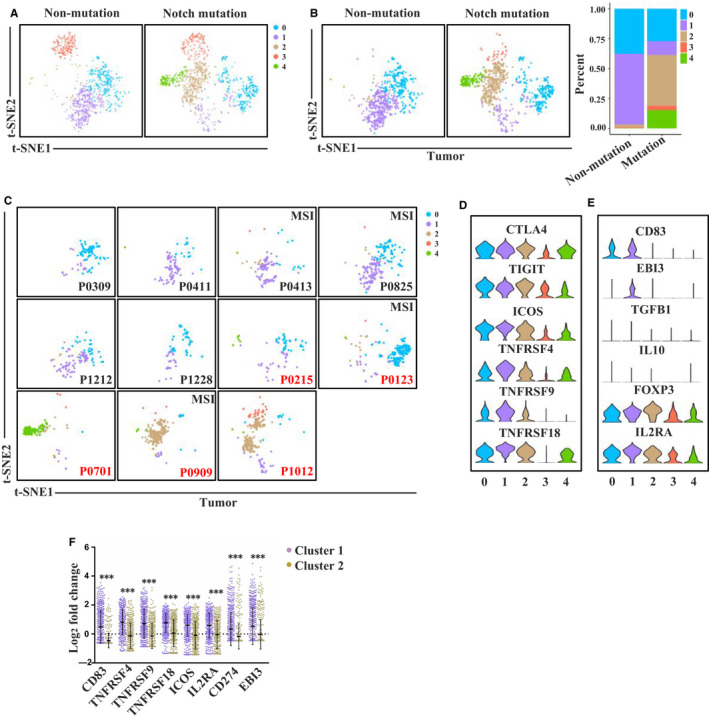
Gene expression profiles of Treg cells in GSE108989 single T cell sequencing data set. A, t‐SNE plot of Treg cells from Notch signalling pathway mutation and non‐mutation patients. B, t‐SNE plot of Treg cells derived from tumour microenvironment between Notch signalling pathway mutation and non‐mutation patients. C, t‐SNE plot of Treg cells derived from tumour microenvironment of each patient. Patients in red are Notch signalling pathway mutation ones. D, Violin plots showing normalized expression of immune checkpoints in Treg cell clusters. E, Violin plots showing normalized expression of inhibitory function related molecules in Treg cell clusters. F, The expression of immune checkpoint and inhibitory function related molecules in cluster 1 and cluster 2 (***P < 0.001, tested by Mann‐Whitney U test)
