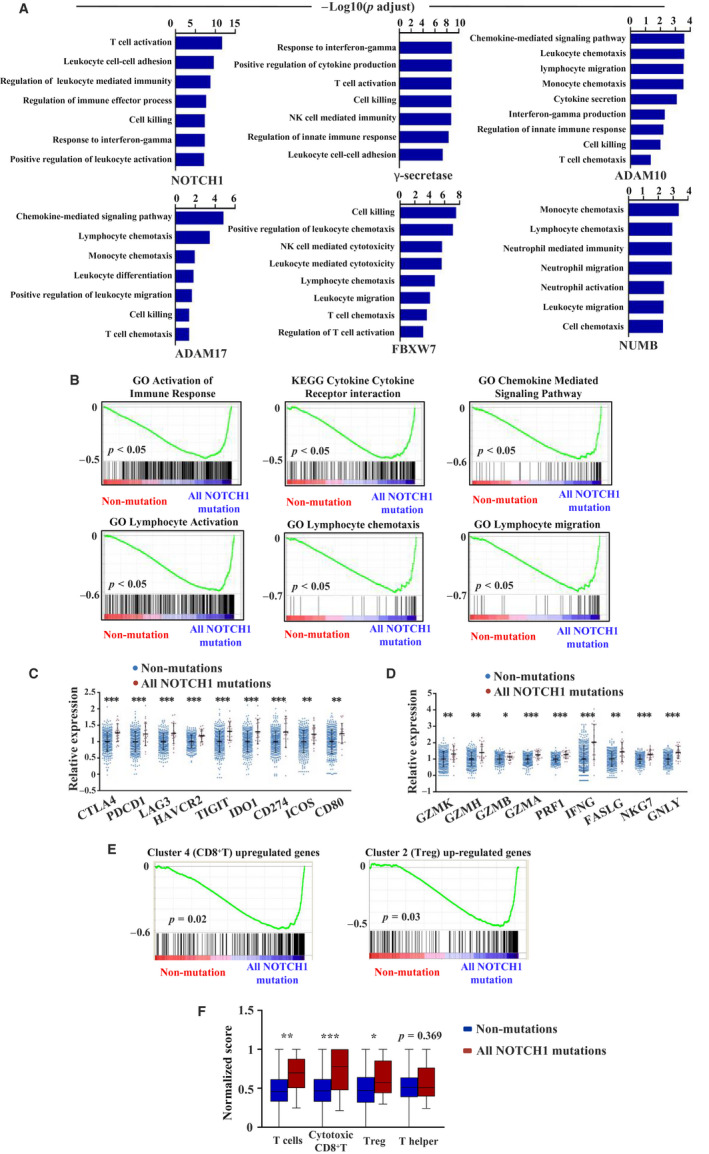
Figure 3.

Gene set enrichment analysis of Notch pathway mutation (overlap mutation and single mutation) in TCGA data set. A, Up‐regulated gene sets in Notch signalling pathway mutation group (NOTCH1, γ‐secretase, ADAM10, ADAM17, FBXW7 and NUMB) compared with non‐mutation group by GO analysis. B, Significant enrichment of immune‐related pathway between all NOTCH1 mutation group and non‐mutation group by KEGG and GO analysis. C, Relative expression of immune checkpoint molecules in all NOTCH1 mutation and non‐mutation groups (**P < 0.01, ***P < 0.001, tested by Mann‐Whitney U test). D, Relative expression of effector molecules in all NOTCH1 mutation and non‐mutation groups (*P < 0.05, **P < 0.01, ***P < 0.001, tested by Mann‐Whitney U test). E, GSEA analysis of all NOTCH1 mutation and non‐mutation groups. F, Normalized scores of different T cell subsets between all NOTCH1 mutation group and non‐mutation group (*P < 0.05, **P < 0.01, ***P < 0.001, tested by Mann‐Whitney U test)
