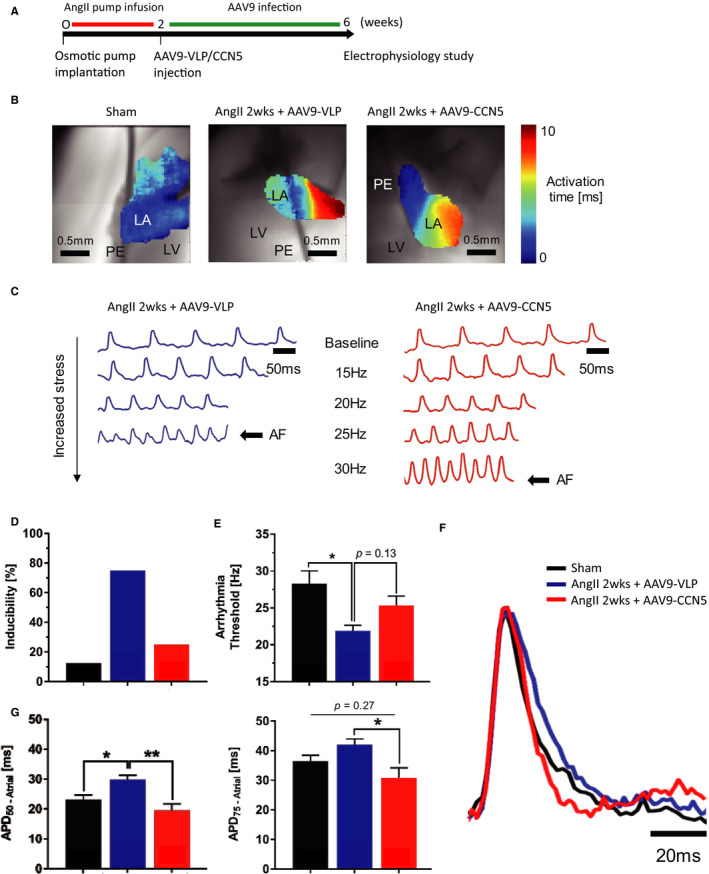
FIGURE 4.

CCN5 decreases predilection for atrial‐induced arrhythmia in fibrotic hearts. A, Experimental scheme is shown. B, Representative maps for each group showing delays in atrial activation time at baseline (10 Hz) in AngII hearts (7.6 ± 2.4 ms) compared to sham (4.5 ± 1.6 ms) indicative of conduction slowing, which was partially reversed in AAV9‐CCN5–treated hearts (5.8 ± 1.5 ms). Scale bar: 0.5 mm, activation time: 0‐10 ms, LV = left ventricle, LA = left atrium, PE = pacing electrode. C, Representative optical mapping traces showing that a higher pacing frequency is necessary to induce atrial arrhythmia in AAV9‐CCN5–treated hearts compared to AngII, indicating lower arrhythmia vulnerability and reverse remodelling. Scale bar: 50 ms AF = atrial fibrillation. D, Bar graph shows a higher susceptibility to atrial arrhythmia at cut‐off frequency of 22 Hz (PCL 44 ms). E, Bar graph shows a higher susceptibility to atrial arrhythmia at cut‐off frequency of 22 Hz (PCL 44 ms). E, Bar graph shows a significantly lower threshold to induced atrial arrhythmia in the AngII hearts (21.9 ± 0.8 Hz in AngII, 28.3 ± 1.7 Hz in sham) *P < 0.05 (one‐way ANOVA followed by post hoc Tukey test). F and G, Representative atrial action potential and APD bar graphs at 10 Hz showing a prolongation of APD in fibrotic hearts (APD50 = 29.9 ± 1.4 ms in AngII vs. APD50 = 23.1 ± 1.5 ms in sham). AAV9‐CCN5 restores APD to normal values (APD50 = 19.5 ± 2.2 ms, APD75 = 30.9 ± 3.4 ms in AAV9‐CCN5 vs. APD75 = 42.1 ± 1.9 ms in AngII). Scale bar 20 ms *P < 0.05, **P < 0.01 (one‐way ANOVA followed by post hoc Tukey test). Data obtained from eight mice were analysed through D ~ G
