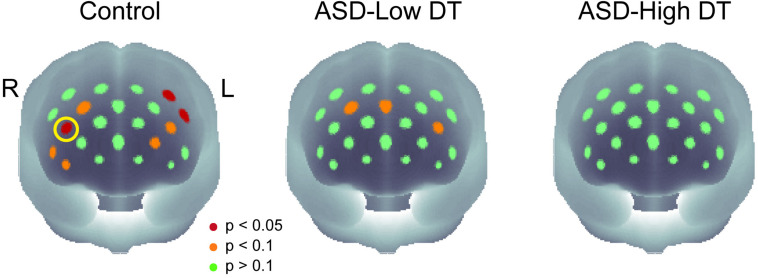
FIGURE 5.
The p-maps of the averaged concentration changes in oxy-Hb for the three groups. CH13 that showed significant difference in response between the control group and the ASD-High DT group was marked using a yellow circle. The corresponding brain region of CH13 was estimated as right dorsolateral prefrontal cortex (DLPFC) using virtual spatial registration (Tsuzuki et al., 2007).

