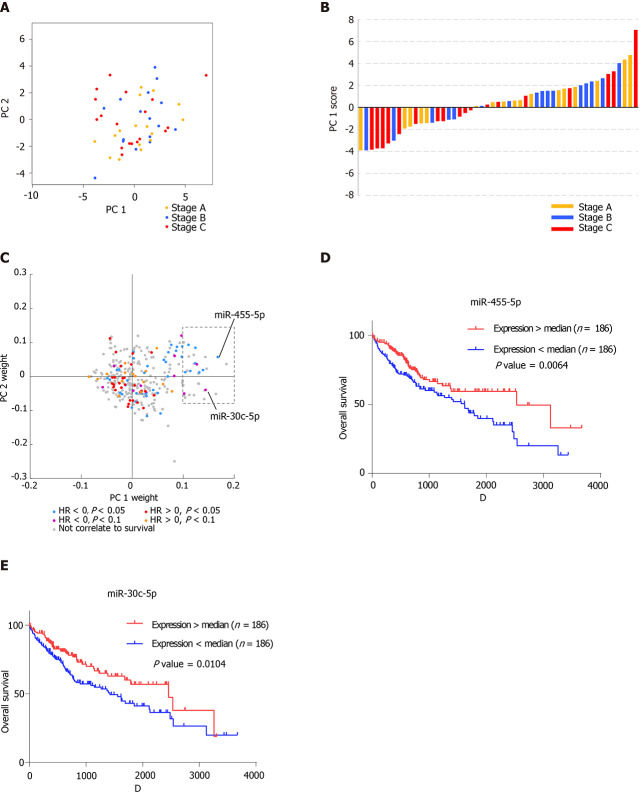
Figure 3.
Blood exosomal micro ribonucleic acid profiles reveal the stage of tumor tissues. A: Distribution of hepatocellular carcinoma patients with stage A, stage B, and stage C on principal components 1 (PC1) and PC2. The yellow represents the patients with stage A, the blue represents the patients with stage B, and the red represents the patients with stage C; B: Histogram displaying PC1 scores of patients with stage A, stage B, and stage C. The histogram color is labeled as in A; C: Distribution of PC1 weight and PC2 weight of each micro ribonucleic acid. The colorindicates the hazardous levels based on The Cancer Genome Atlas data; D: Kaplan–Meier analysis of overall survival of two groups (high expression and low expression of miR-455-5p); E: Kaplan–Meier analysis of overall survival of the two groups (high expression and low expression of miR-30c-5p).

