Figure 2.
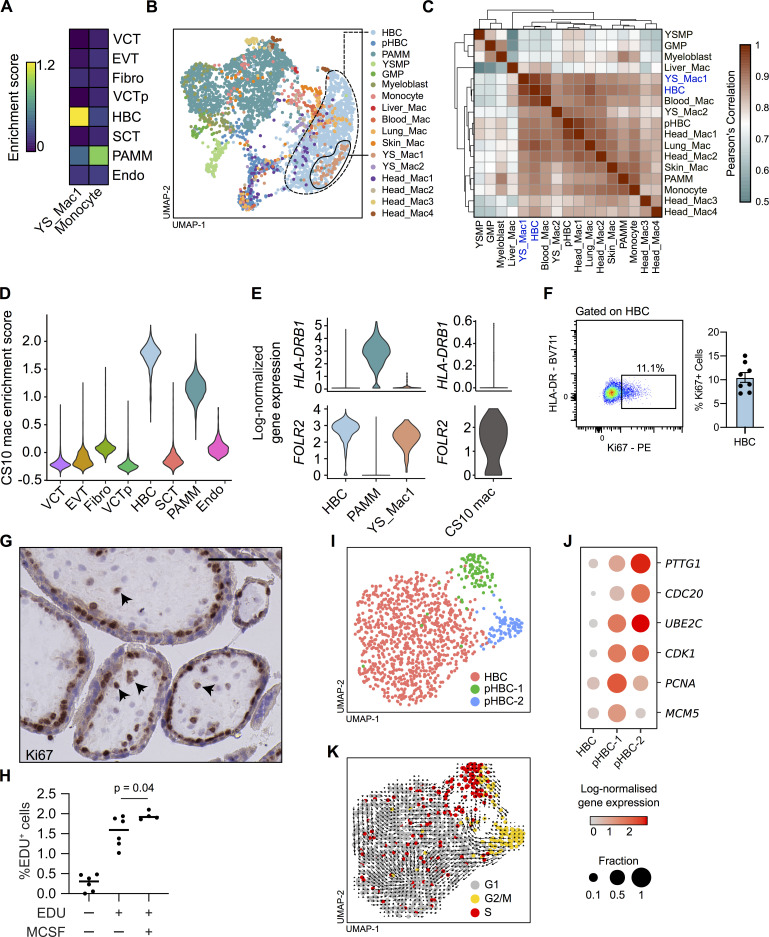
First-trimester HBCs are transcriptionally similar to primitive macrophages and proliferate in situ. (A) Heatmap of placental scRNA-seq cluster mean enrichment scores for extraembryonic YS macrophage and embryonic monocyte gene signatures (Bian et al., 2020). Endo, endothelial cells; EVT, extravillous trophoblast; Fibro, fibroblasts; VCT, villous cytotrophoblast; VCTp, proliferating villous cytotrophoblast. (B) UMAP visualization of 3,846 single-cell transcriptomes from first-trimester placenta and embryonic myeloid cells (Bian et al., 2020). GMP, granulocyte–monocyte progenitors; pHBC, proliferating HBCs; YS_Mac, YS macrophage; YSMP, YS-derived myeloid-biased progenitors. (C) Heatmap depicting transcriptomic similarity between annotated clusters. Clusters are ordered according to hierarchical clustering. HBCs and YS_Mac1s are highlighted in blue. (D) Violin plot of placental scRNA-seq cluster enrichment scores for primitive macrophages from a CS10 embryo (Zeng et al., 2019). (E) Violin plots of HLA-DRB1 and FOLR2 log-normalized gene expression in HBCs, PAMMs, YS_Mac1s, and CS10 macrophages. (F) Representative flow cytometric plot and quantification of Ki67 expression by HBCs (n = 8). (G) Representative immunohistochemistry analysis of Ki67 expression in placental tissue sections. Arrowheads indicate Ki67+ cells. Scale bar, 100 µm. (H) Incorporation of EdU into FACS-isolated HBCs after 18 h culture, with and without the addition of M-CSF (n ≥ 4); P value was calculated by one-way ANOVA. (I) UMAP visualization of 1,091 HBC single-cell transcriptomes identifying two proliferating HBC populations. (J) Dotplot heatmap of log-normalized gene expression of genes associated with stages of the cell cycle in HBC clusters. Dot size represents fraction of cells with nonzero expression. (K) UMAP visualization of HBCs with cells colored by predicted cell cycle state, as determined by cell cycle scoring, with RNA velocity vector field projection calculated from all genes in all cells (arrows) overlain. Data are represented as mean ± SEM (F) or mean alone (H).

