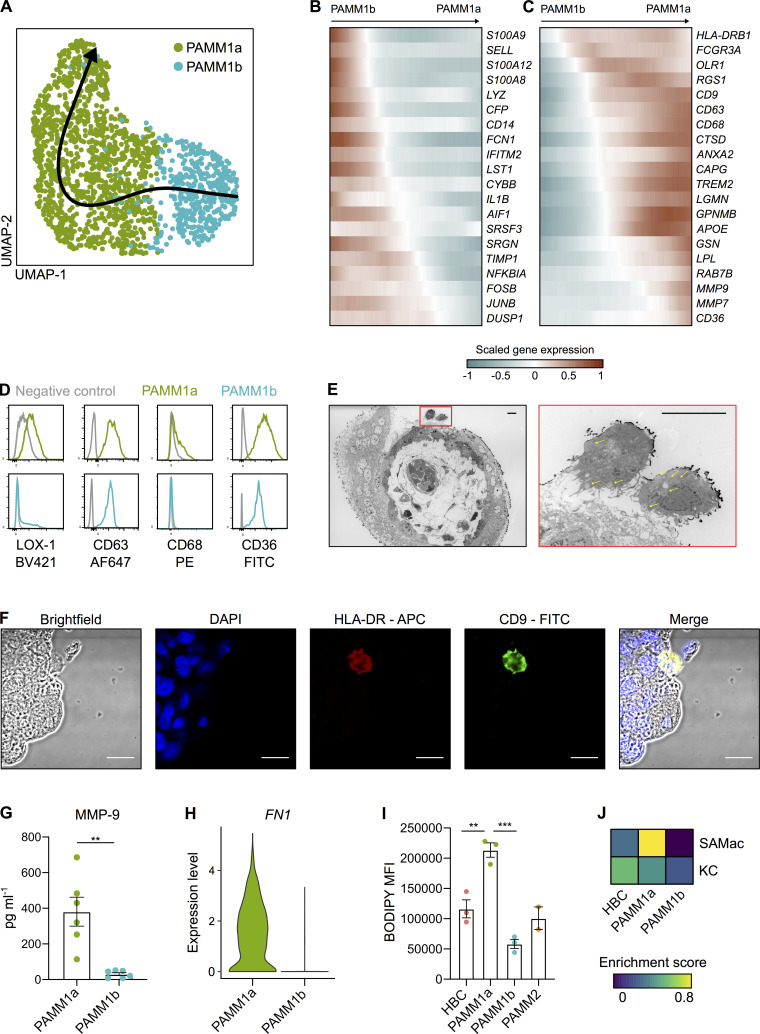
Figure 4.
PAMM1 undergo a monocyte-to-macrophage transition and adopt a tissue-repair phenotype on the placental surface. (A) UMAP visualization of 1,687 PAMM single-cell transcriptomes with Slingshot trajectory overlain. (B and C) Heatmaps of smoothed scaled gene expression of selected genes that are down-regulated (B) and up-regulated (C) during PAMM1b to PAMM1a differentiation, ordered according to Slingshot trajectory. (D) Relative surface expression of markers identified in C in PAMM1a (green) and PAMM1b (cyan), compared with fluorescence minus one (FMO) control (gray), measured by flow cytometry. Representative plots of n = 3. (E) Transmission electron microscopy of first-trimester placental villous cross section. PAMM1a can be observed on the placental surface, localized to sites of damage to the syncytial layer (red inset). PAMM1a’s are loaded with lipid droplets (arrows). Scale bars, 20 µm. (F) Identification of CD9+ (green) HLA-DR+ (red) PAMM1a cells on the surface of a 9-wk EGA placental sample by fluorescence microscopy. Representative image of n = 3 experiments. Cell nuclei are stained with DAPI (blue). Scale bars, 20 µm. (G) Secretion of MMP-9 by FACS-isolated PAMM1a and PAMM1b after overnight culture (n = 6). P value calculated by unpaired t test. (H) Log-normalized gene expression of fibronectin (FN1) in PAMM1a and PAMM1b clusters, as determined from scRNA-seq data. (I) Analysis of intracellular neutral lipid content by flow cytometry following staining with BODIPY; mean fluorescence intensity (MFI) of HBC and PAMM subsets is shown. P values calculated by one-way ANOVA with Tukey’s multiple-comparisons test. (J) Heatmap of placental macrophage mean enrichment scores for KC and SAMac gene signatures (Ramachandran et al., 2019). Data are represented as mean ± SEM. **, P ≤ 0.01; ***, P ≤ 0.001.

