Figure 6.
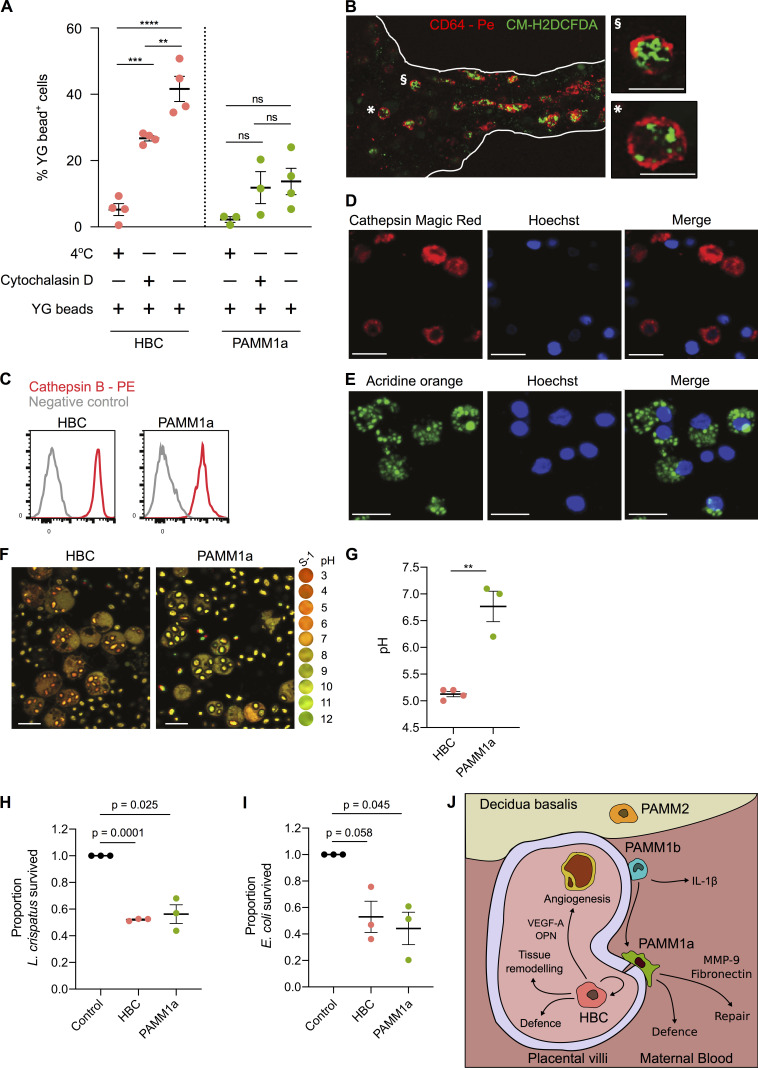
HBCs are capable of mounting a microbicidal response. (A) Phagocytosis of Fluoresbrite Yellow Green Microspheres (YG beads) by FACS-isolated HBC and PAMM1a measured by flow cytometry. P values were calculated by two-way ANOVA with Tukey’s multiple-comparisons test (n ≥ 3). (B) Whole-mount immunofluorescence microscopy of a placental villus showing CD64 expression (red) and ROS-dependent probe CM-H2DCFDA (green). Edges of villus are indicated by white lines. Right panels show magnification of individual cells, denoted by symbols. Scale bars, 20 µm. Representative image of n = 3 experiments. (C) Relative expression of cathepsin B in HBCs and PAMM1a to FMO control (gray), measured by flow cytometry (n = 3). (D) Cathepsin B activity in FACS-isolated HBCs, co-cultured with zymosan particles, determined by cathepsin B Magic Red staining. Scale bars, 20 µm. Representative images of n = 3. (E) AO staining of lysosomes in FACS-isolated HBCs co-cultured with zymosan particles. Scale bars, 20 µm. Representative images of n = 3 experiments. (F and G) Comparison of the phagosomal pH of HBCs and PAMM1a. (F) Representative images of phagosomal pH of FACS-isolated HBCs and PAMM1a after co-culture with Carboxy S-1–labeled zymosan particles for 20 min. The cytosol is labeled with 5- (and 6-) carboxy S-1 acetoxymethyl (S-1-AM) ester, a cell-permeant pH indicator. Right panel shows the pH scale. (G) Quantification of phagosomal pH; each data point represents an average of >100 measurements per separate donor (n ≥ 3). P value was calculated by unpaired t test. (H and I) Rates of L. crispatus (H) and E. coli (I) killing by HBCs and PAMM1a after 1 h co-culture at an MOI of 1, relative to negative control, where no macrophages were added. P values were calculated by a one-sample t test (n = 3). (J) Schematic depicting locations and subset-specific roles of placental macrophages. Data are represented as mean ± SEM. ns, not significant (P > 0.05); **, P ≤ 0.01; ***, P ≤ 0.001; ****, P ≤ 0.0001.

