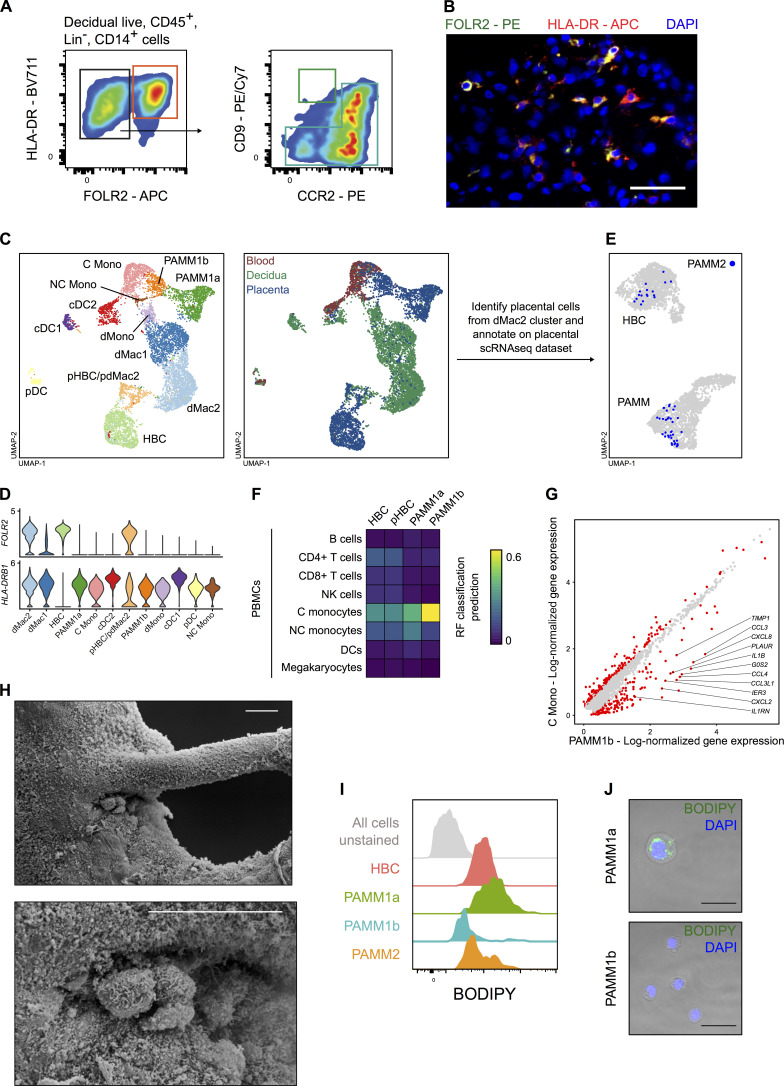
Figure S2.
Identification of PAMM populations. (A) Flow cytometric analysis of decidual CD14+ cells. Cells with a phenotype consistent with PAMM2 (FOLR2+ HLA-DR+; red gate) and PAMM1b (blue gate) were readily identified. Cells with a phenotype consistent with PAMM1a were low in abundance (green gate). Representative flow cytometric plots from n = 3 experiments. (B) Identification of HLA-DR+ (red) FOLR2+ (green) macrophages in the decidua by fluorescence microscopy. Cell nuclei are stained with DAPI (blue). Scale bar, 50 µm. Representative image of n = 2 experiments. (C) UMAP visualization of 9,474 myeloid cells from placenta, decidua, and maternal blood (Vento-Tormo et al., 2018). Cells are colored and labeled by cluster identity (left panel) and tissue of origin (right panel). cDC1, conventional type 1 dendritic cells; cDC2, conventional type 2 dendritic cells; C mono, classical monocytes; dMac1, decidual macrophages 1; dMac2, decidual macrophages 2; dMono, decidual monocytes; NC Mono, nonclassical monocytes; pDC, plasmacytoid dendritic cells; pHBC/pdMac2, proliferating HBCs and dMac2s. (D) Violin plots showing log-normalized gene expression of FOLR2 and HLA-DRB1 in placental, decidual, and maternal blood myeloid cells. (E) Annotation of PAMM2 (placental cells within dMac2 cluster; blue) onto original UMAP embedding of HBCs and PAMMs from the placental scRNA-seq dataset (Fig. S1 F). (F) Heatmap of transcriptional similarity between placental macrophage/monocyte cell clusters and indicated PBMC populations, as determined using a random forest (RF) classification prediction. DC, dendritic cell; NK, natural killer; p-HBC, proliferating HBC. (G) Scatterplot showing log-normalized gene expression of PAMM1b (x axis) and maternal blood classical monocyte (y axis) clusters. Red dots represent genes that are differentially expressed with an adjusted P value < 0.01 (Wilcoxon rank sum test). (H) Scanning electron micrographs of PAMM1a on the surface of a first-trimester placenta, adhering to a site of damage on a branching villus. Scale bars, 20 µm. (I) Representative flow cytometric histograms of BODIPY staining within HBC and PAMM subsets compared with unstained cells (gray). (J) Images of BODIPY staining of FACS-isolated PAMM1a and PAMM1b. Scale bars, 20 µm. Representative images of n = 2 experiments.

