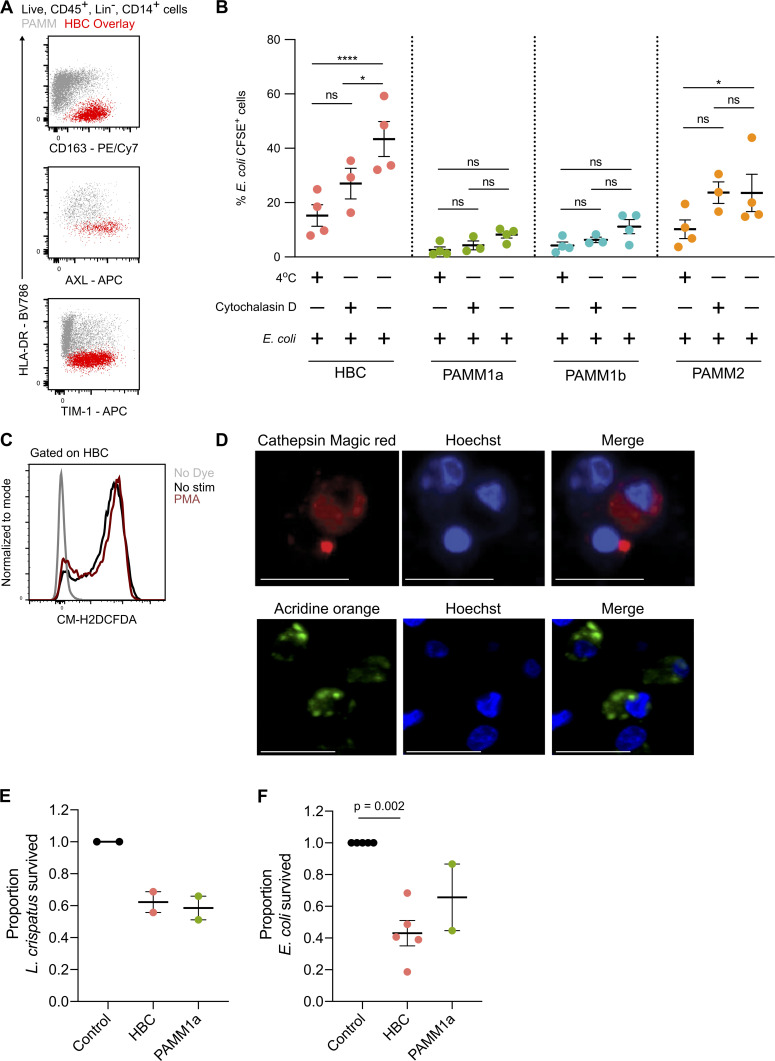
Figure S5.
Phagocytic and antibacterial capacity of HBCs and PAMM1a. (A) Flow cytometric plots of scavenger receptor expression in HBCs (red) and PAMMs (gray). Representative plots of n = 3 experiments. (B) Phagocytosis of CFSE-labeled E. coli by HBC, PAMM1a, PAMM1b, and PAMM2 subsets measured by flow cytometry. P values were calculated by two-way ANOVA with Tukey’s multiple-comparisons test (n ≥ 3). (C) Representative flow cytometric plot of CM-H2DCFDA staining in FACS-isolated HBCs with no stimulation (black) and with PMA (red) relative to no stain (gray; representative plot from n = 3 experiments). (D) Cathepsin B activity, determined by cathepsin B Magic Red staining, and AO staining of lysosomes in FACS-isolated PAMM1a co-cultured with zymosan particles. Scale bars, 20 µm. Representative images of n = 3 experiments. (E and F) Rates of L. crispatus (E) and E. coli (F) killing by HBCs and PAMM1a after 1 h co-culture at an MOI of 10 relative to negative control, where no cells were added. P values were calculated by one sample t test (n ≥ 2). Data are represented as mean ± SEM. ns, not significant (P > 0.05); *, P ≤ 0.05; ****, P ≤ 0.0001.

