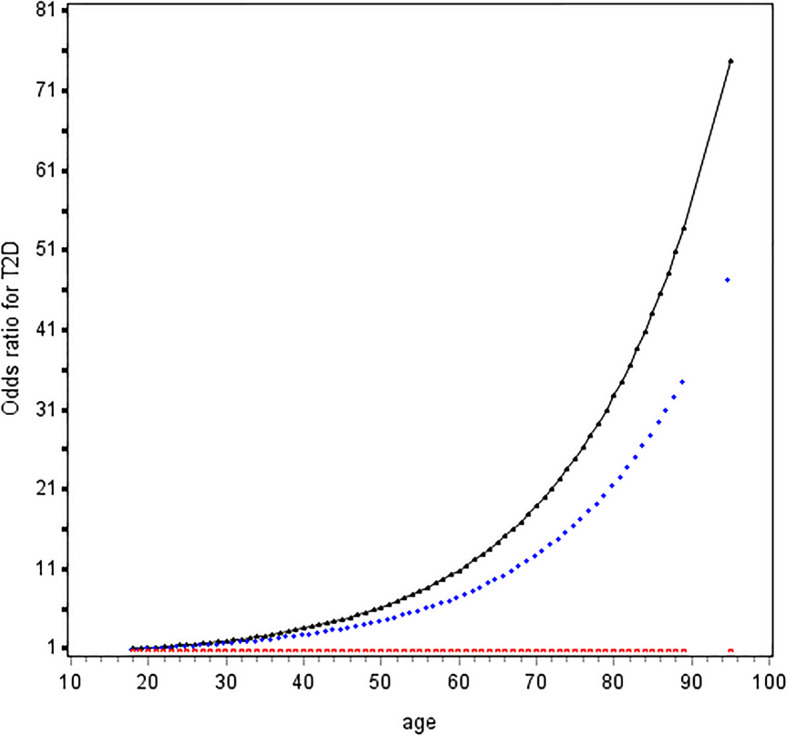
Fig. 1.

Odds ratio curves of age for T2D risk. Abbreviations: T2D, type 2 diabetes. The black curve was derived from univariable analysis, and the blue curve derived from multivariate analysis that adjusted for body mass index (< 18.5, 18.5 ~ 24.0, 24.0 ~ 28.0, and ≥ 28.0 kg/m2), systolic blood pressure (< 140 and ≥ 140 mmHg), low-density lipoprotein cholesterol (< 2.60 and ≥ 2.60 mmol/L), high-density lipoprotein cholesterol (< 1.00 mmol/L in male or < 1.30 mmol/L in female as low level and ≥ 1.00 in male or ≥ 1.30 in female as high level), and triglyceride (< 1.70 mmol/L and ≥ 1.70 mmol/L); The red curve stands for the reference level (i.e., the odds ratio for type 2 diabetes mellitus was 1)
