
Figure 4.
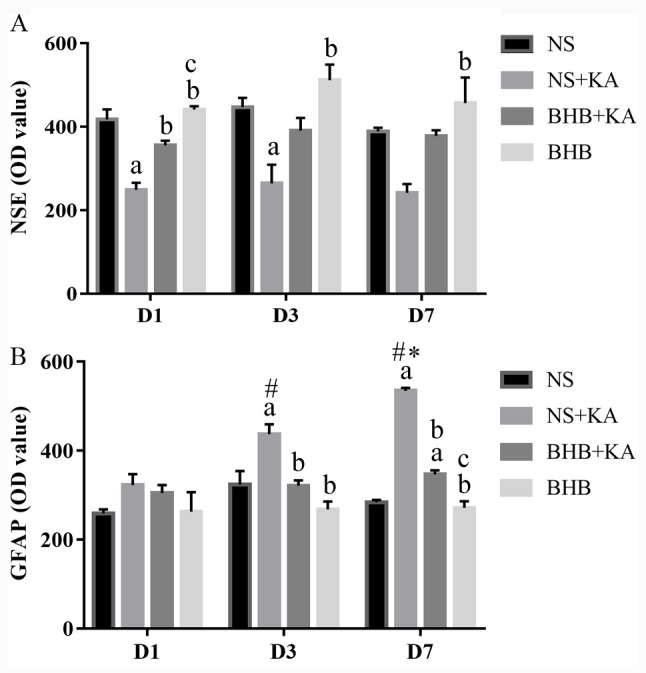
Expression levels of NSE and GFAP in the hippocampal tissue. (A) NSE expression 1, 3 and 7 days after different treatments. KA administration decreased the NSE expression (D1 and D3), whilst BHB alleviated this reduction (D1). (B) GFAP expression 1, 3 and 7 days after different treatments. KA administration increased the GFAP expression but pretreatment with BHB significantly reduced GFAP expression (D3 and D7). aP<0.05 vs. NS; bP<0.05 vs. NS+KA; cP<0.05 vs. BHB+KA; #P<0.05 vs. D1 NS + KA; *P<0.05 vs. D3 NS + KA; OD, optical density; NSE, neuron specific enolase; GFAP, glial fibrillary acidic protein; BHB, β-hydroxybutyrate; KA, kainic acid; NS, normal saline.